Find out how visual safety reporting works…
Workplace safety isn’t just a checklist — it’s a shared responsibility. But safety efforts fall short when critical information is buried in spreadsheets or hidden away in digital systems. That’s why more organisations are turning to visual safety reporting to bring safety data into the open, where it can inform, engage, and drive action.
Why Visual Safety Reporting Works
Clear, visible communication helps teams stay aware, involved, and proactive. Instead of waiting for reports to be circulated or updated, a visual safety reporting system puts key information where everyone can see it — from daily hazards to incident trends.
Using visual tools to report safety data allows teams to:
- Spot recurring issues at a glance
- Stay on top of corrective actions
- Encourage consistent near miss reporting
- Improve accountability across the board
- Reinforce a culture of continuous improvement
- It’s not just about compliance. It’s about making safety part of the conversation, every single day.
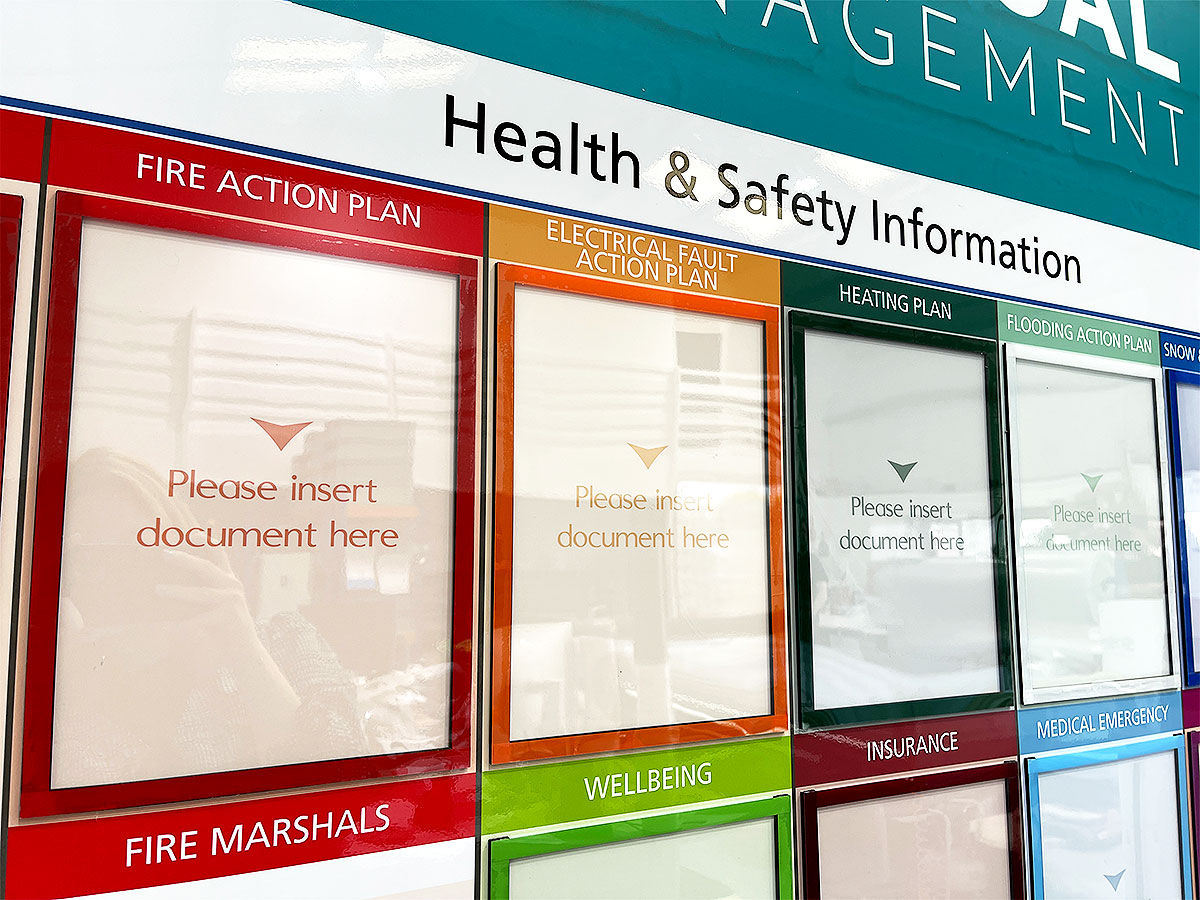
What Should Visual Safety Reporting Include?
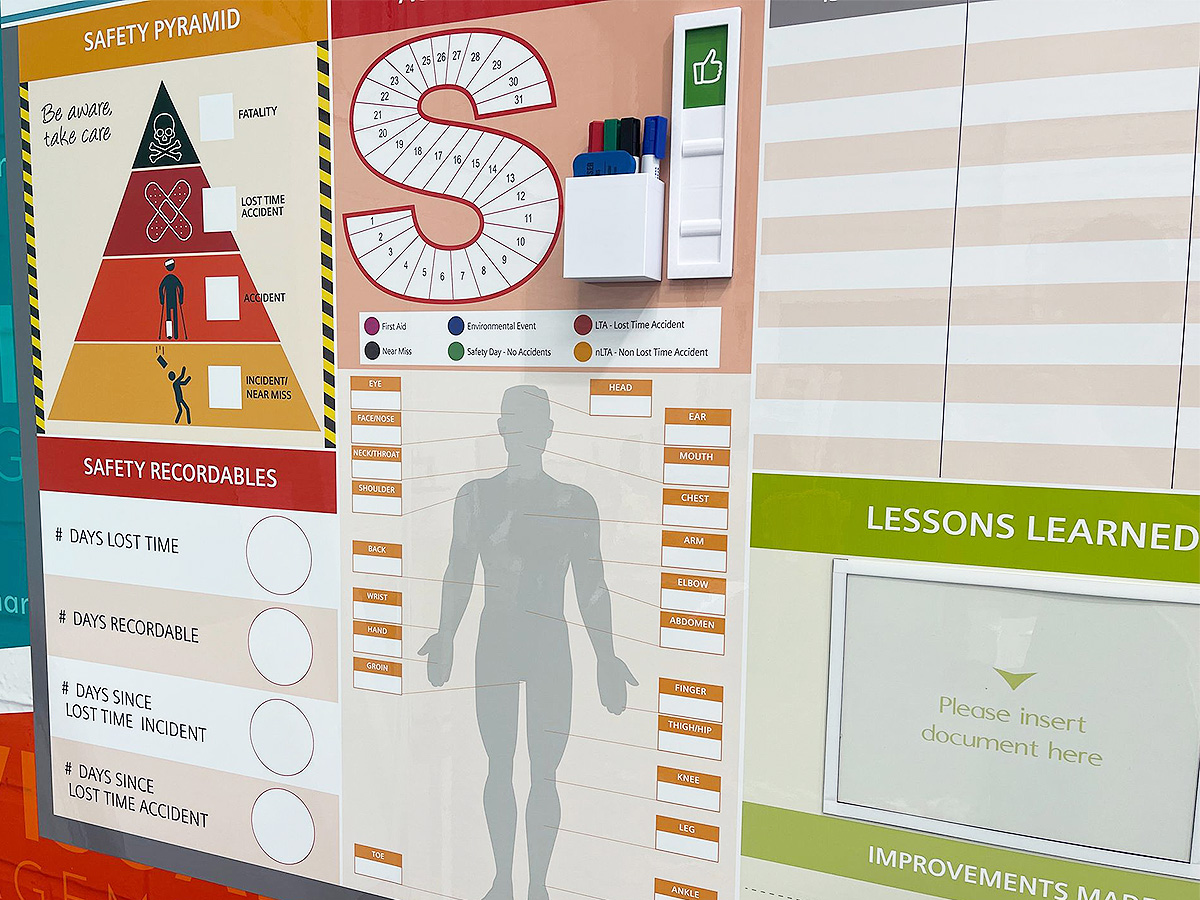
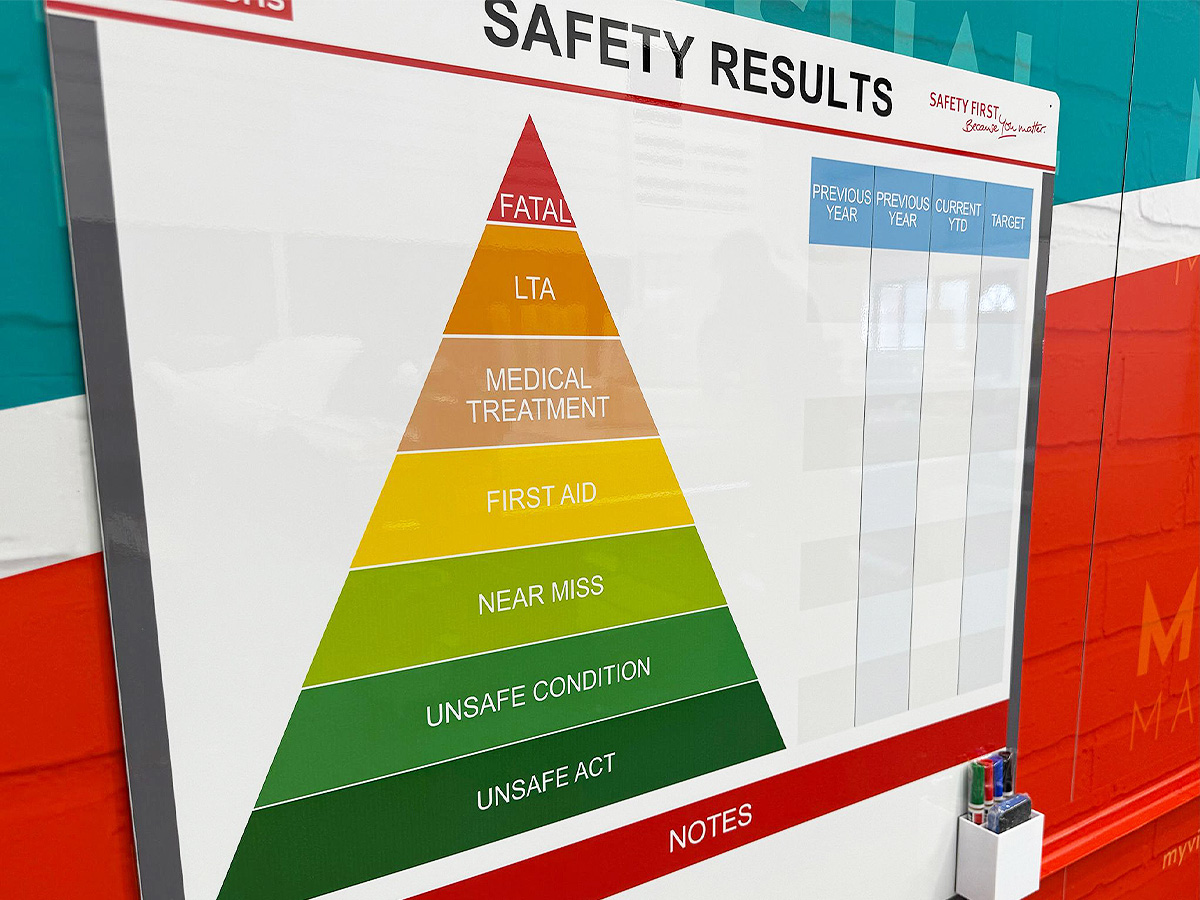
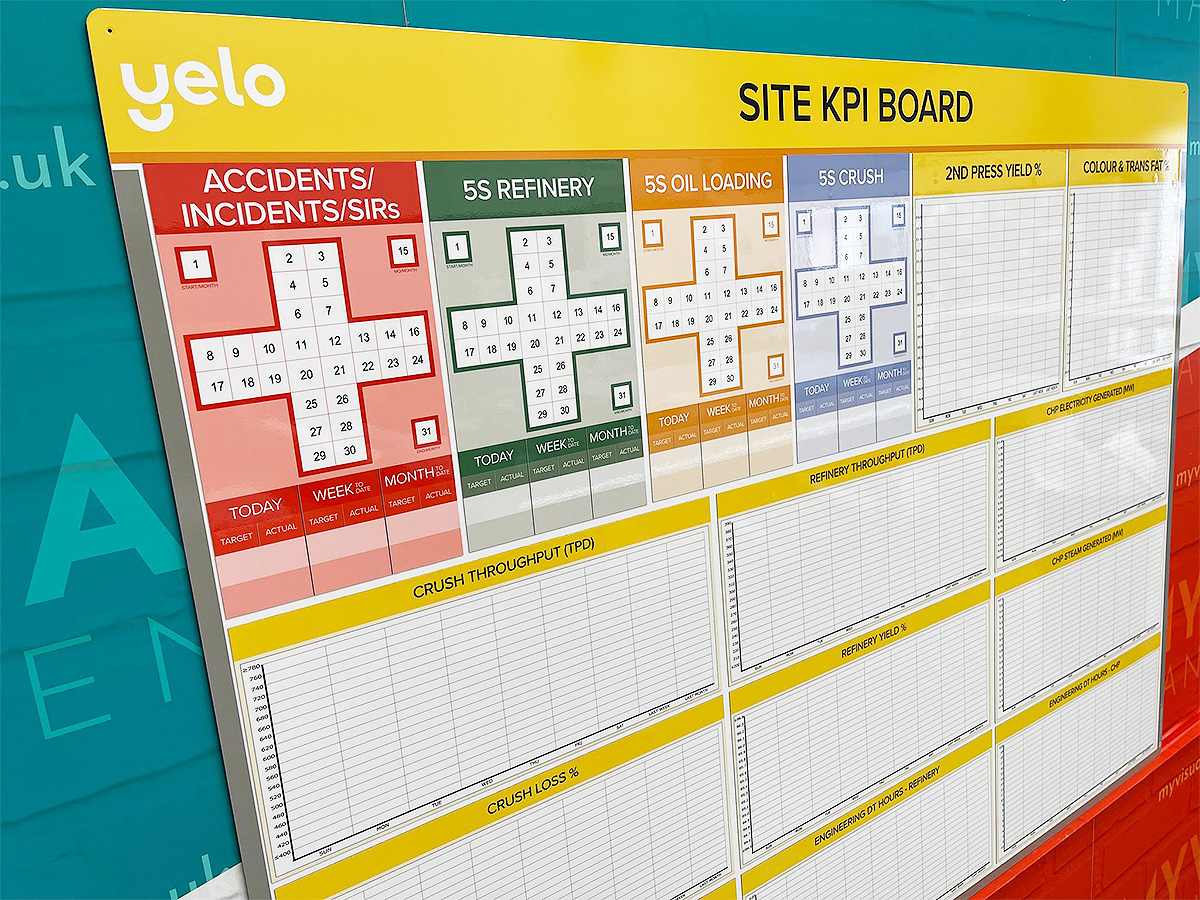
A well-structured visual safety board can display:
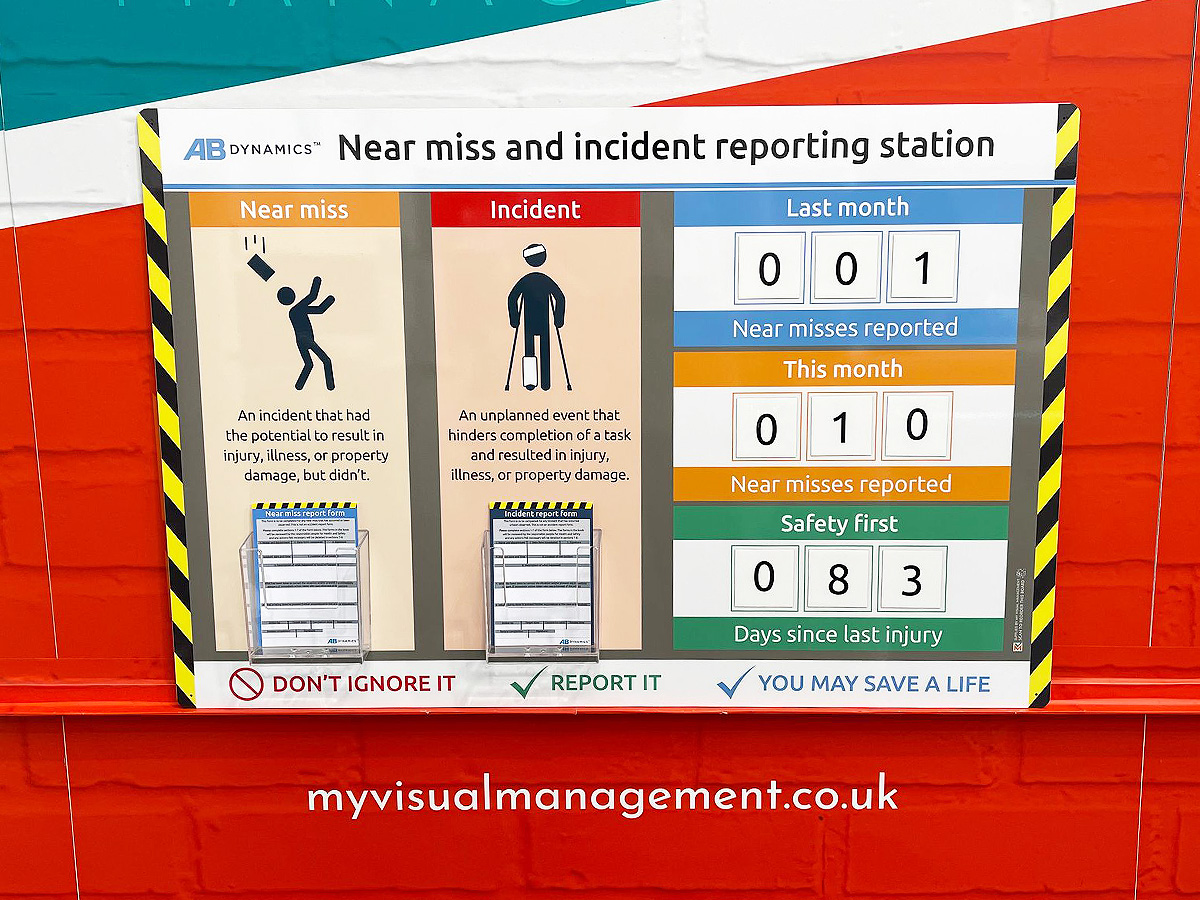
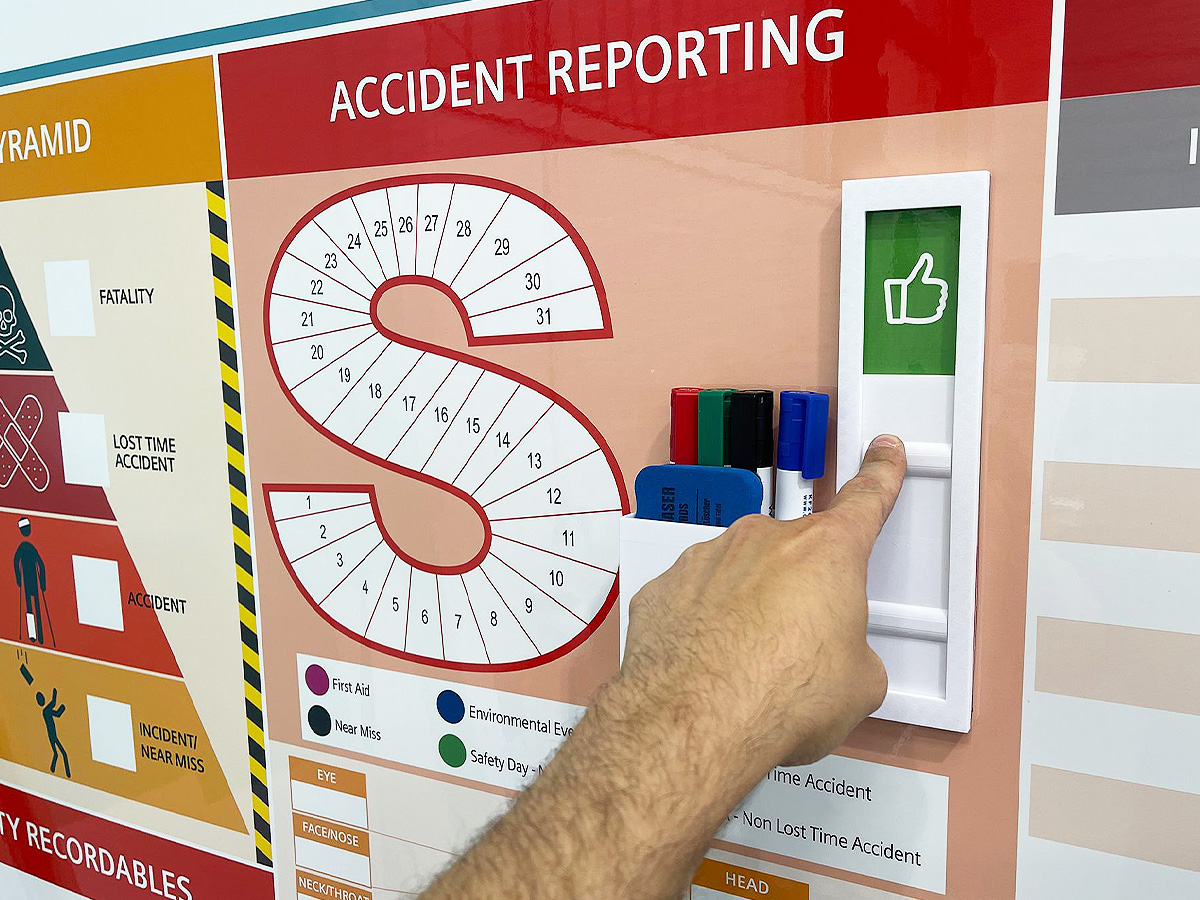
- Accident and incident summaries
- Near miss reports and patterns
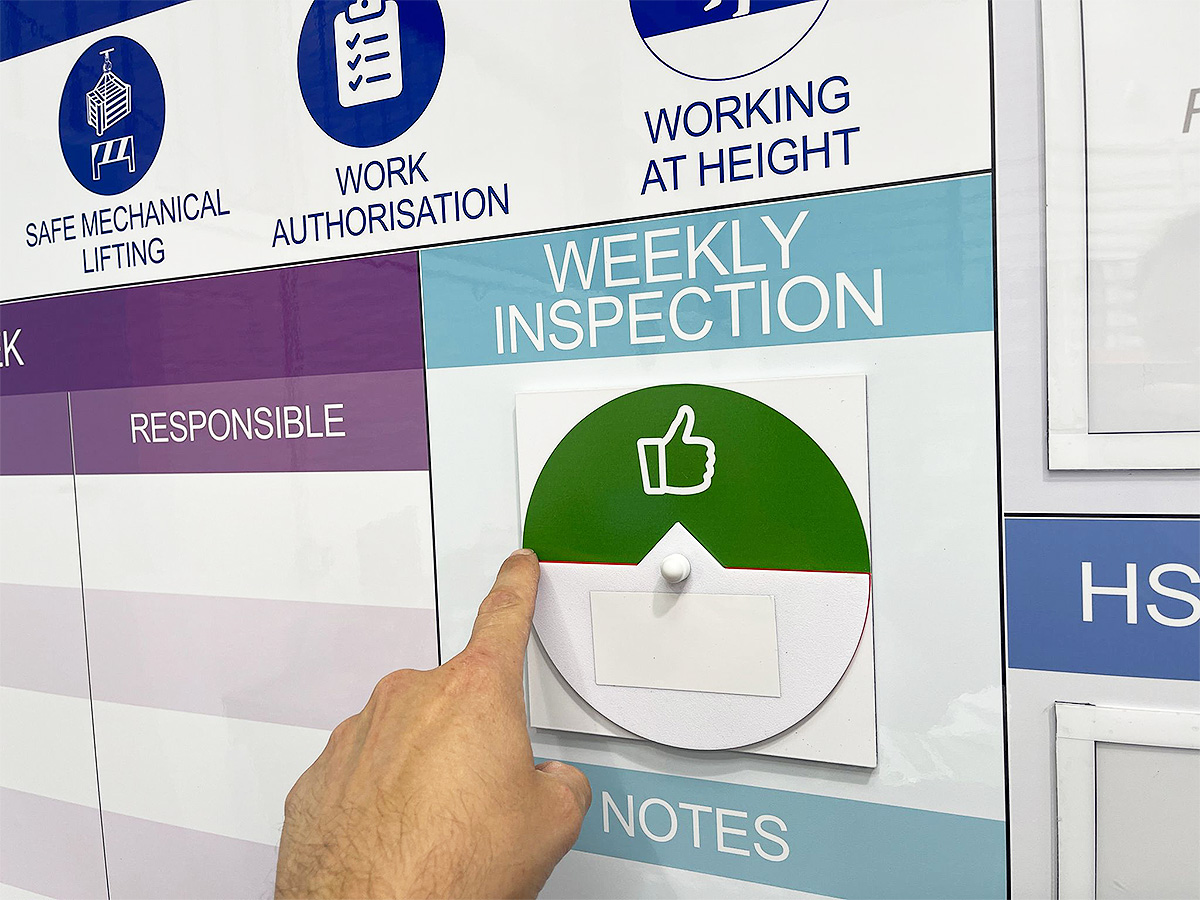
- Actions assigned and completion status
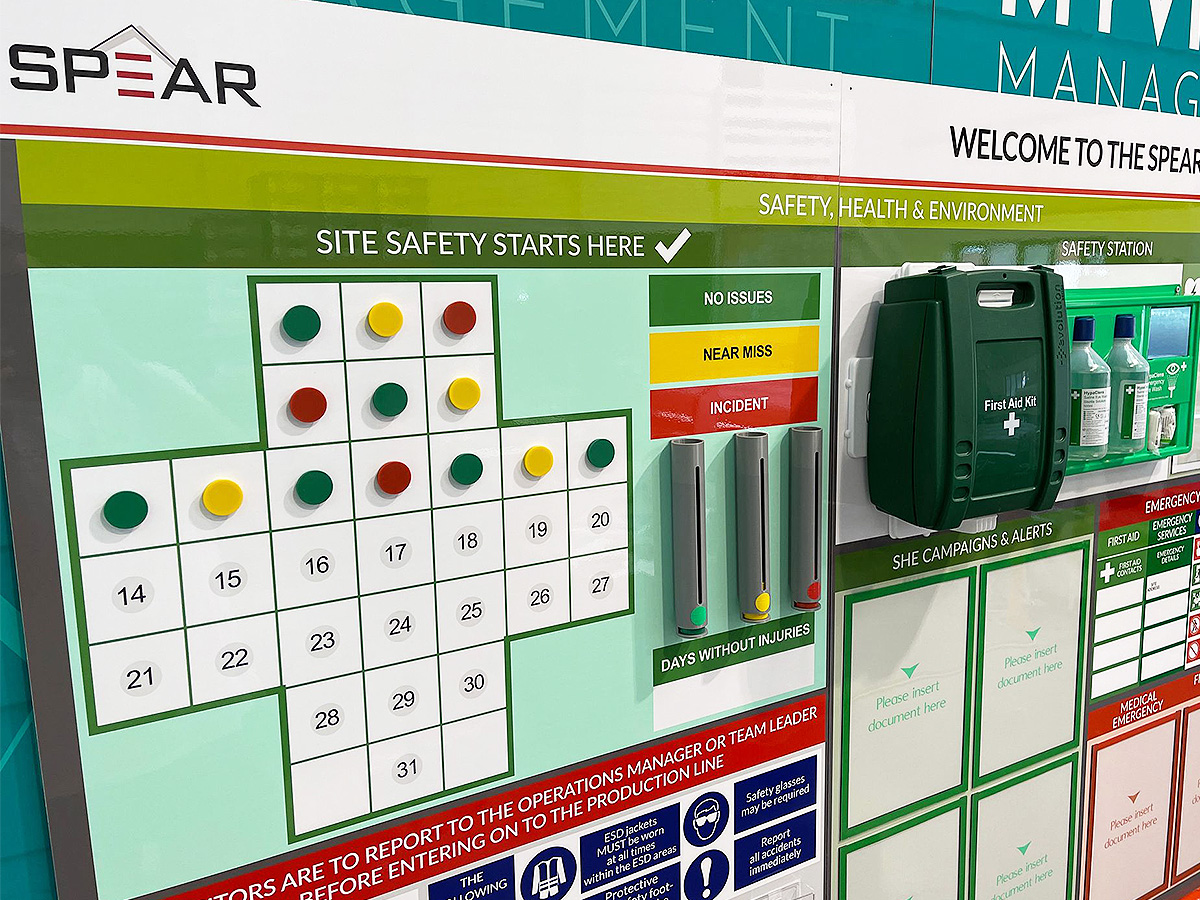
- Safety KPIs like LTIFR or days since last incident
- Hazard observations and team suggestions
- Visual cues or prompts for hazard spotting
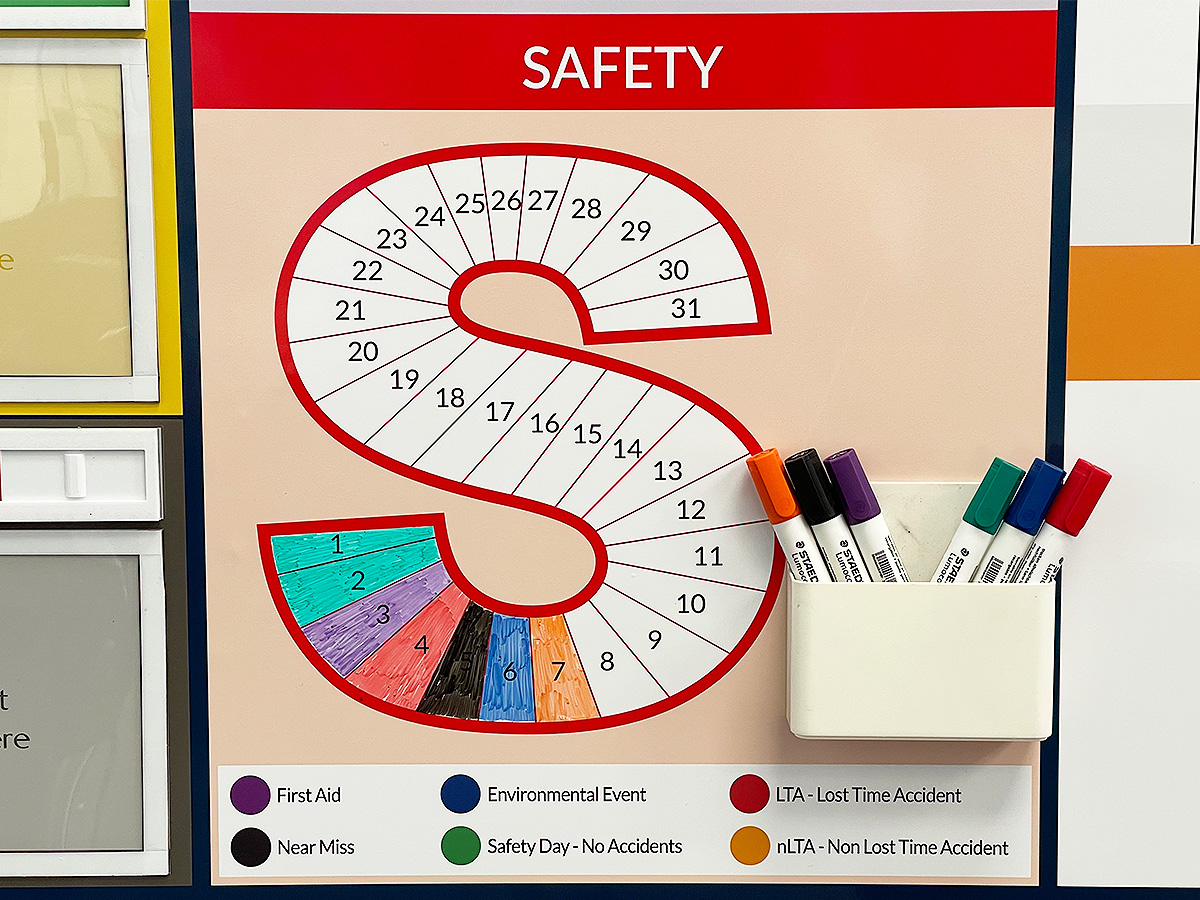
- Adding colour coding, icons, and real-time updates improves readability and engagement. These aren’t just noticeboards — they’re dynamic tools for managing risk.
Encouraging Near Miss Reporting with Visual Tools
Report near misses is essential, yet often difficult. Employees may hesitate due to fear of blame or the belief that nothing will change.
Visual safety reporting helps shift this mindset. By displaying near miss reports publicly and celebrating participation, you show that reporting is valued — not punished. This builds trust and helps teams speak up before something becomes serious.
When reporting is made visible, it becomes part of how work is done — not an extra step.
How to Integrate Visual Safety Reporting Into Daily Routines
Making safety visual only works if it’s used consistently. Fortunately, it’s easy to integrate into the flow of daily operations.
Try this:
- Review the board during toolbox talks or team huddles
- Assign updates to safety reps weekly
- Place visual reporting boards in high-traffic zones
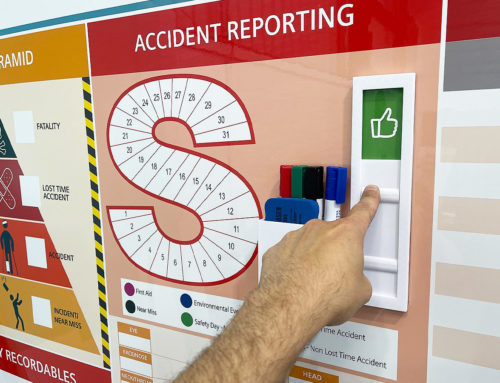
- Use dry-wipe or magnetic formats for real-time updates
- When safety data is visible and regularly updated, it becomes a living tool — not a dusty display.
- Custom Visual Safety Solutions That Work for You
- No two workplaces are alike — and your safety tools shouldn’t be either.
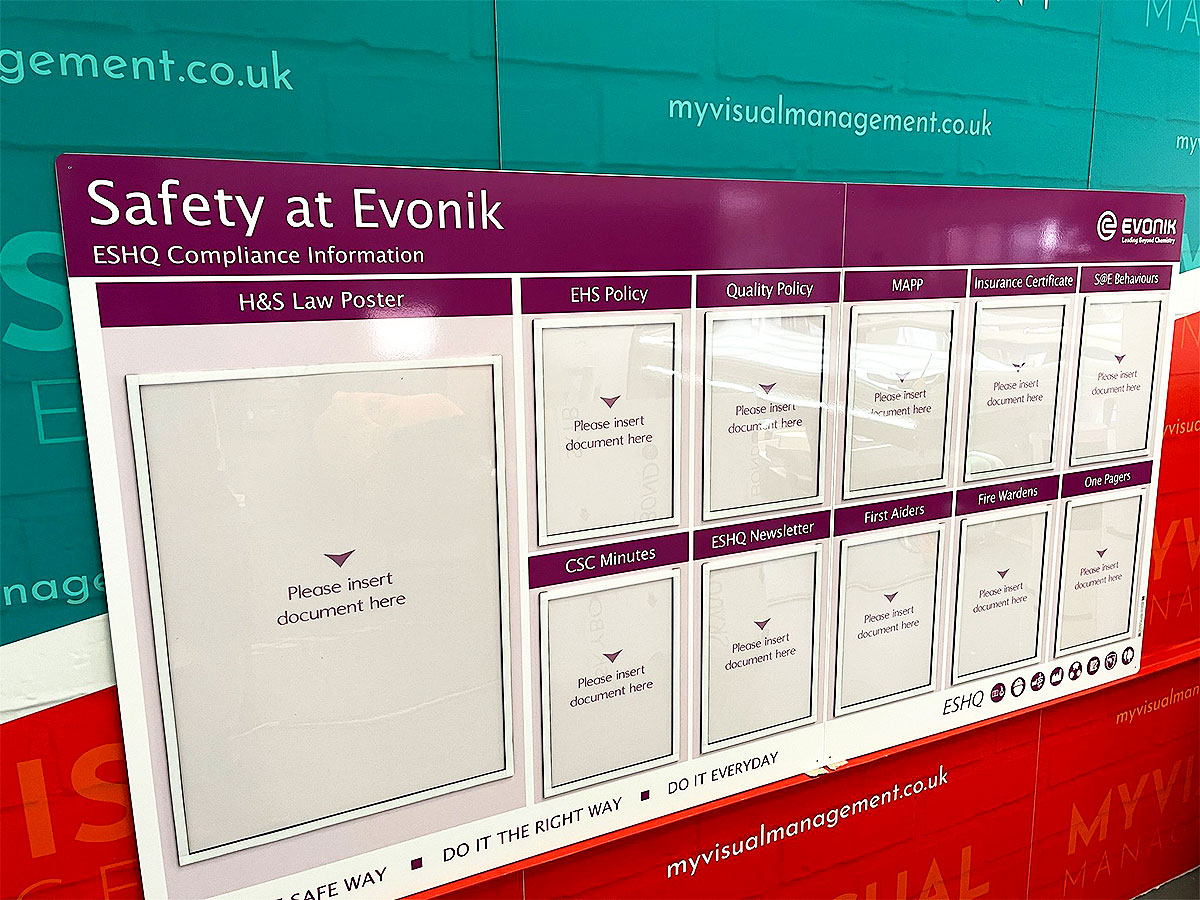
At My Visual Management, we specialise in custom-designed visual safety reporting boards that align with your processes, risks, and team structure. From compact near miss logs to full-scale safety KPI walls, we’ll help you visualise what matters most.
Add status indicators, cleaning links, branded layouts, and flexible sections to keep your board relevant as your safety program evolves.
Why Visual Safety Reporting Matters
Here’s what businesses gain when they make safety visual:
- Better communication across shifts and teams
- Faster identification of risks and trends
- Greater team engagement in safety initiatives
- Higher rates of near miss and hazard reporting
- Reduced accidents and stronger compliance
- In short, it’s not just more visible — it’s more effective.
- Start Visualising Your Safety Improvements
To make a start, feel welcome to reach out
Have comprehensive safety reporting visuals
Update using colour coding – quick, easy and visually effective
Make visual reporting a priority
Ensure your reporting process is simple and visual
Drive a visually engaging culture relating to safety
Show what you need for your site and working pattern
Encourage best habits in a visual way
Choose how to make safety visual


Further examples of our Safety Communications Boards


First Aiders & Fire Marshals info

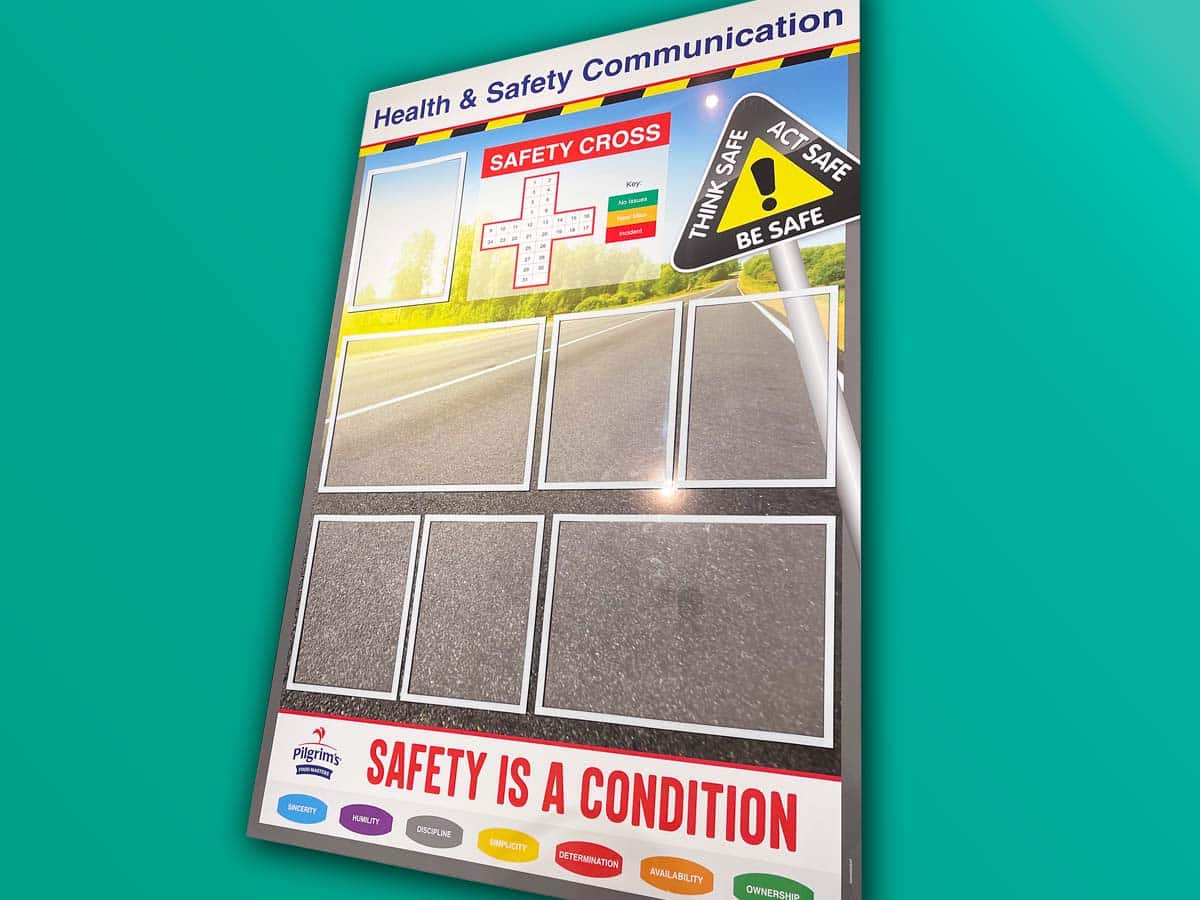
QHSE board

Site safety Board

EH&S communications board

First Aid Station board

Safety key info board
H&S Info board

Dry wipe areas

HSE Board

EH&S board
Site Safety policies board

Show your safety rules

Safety board with first aid kit

Site Communications board

PPE requirements

Safety info for employees

Site evacuation plan

Site Safety Noticeboard
Employee Info board for safety
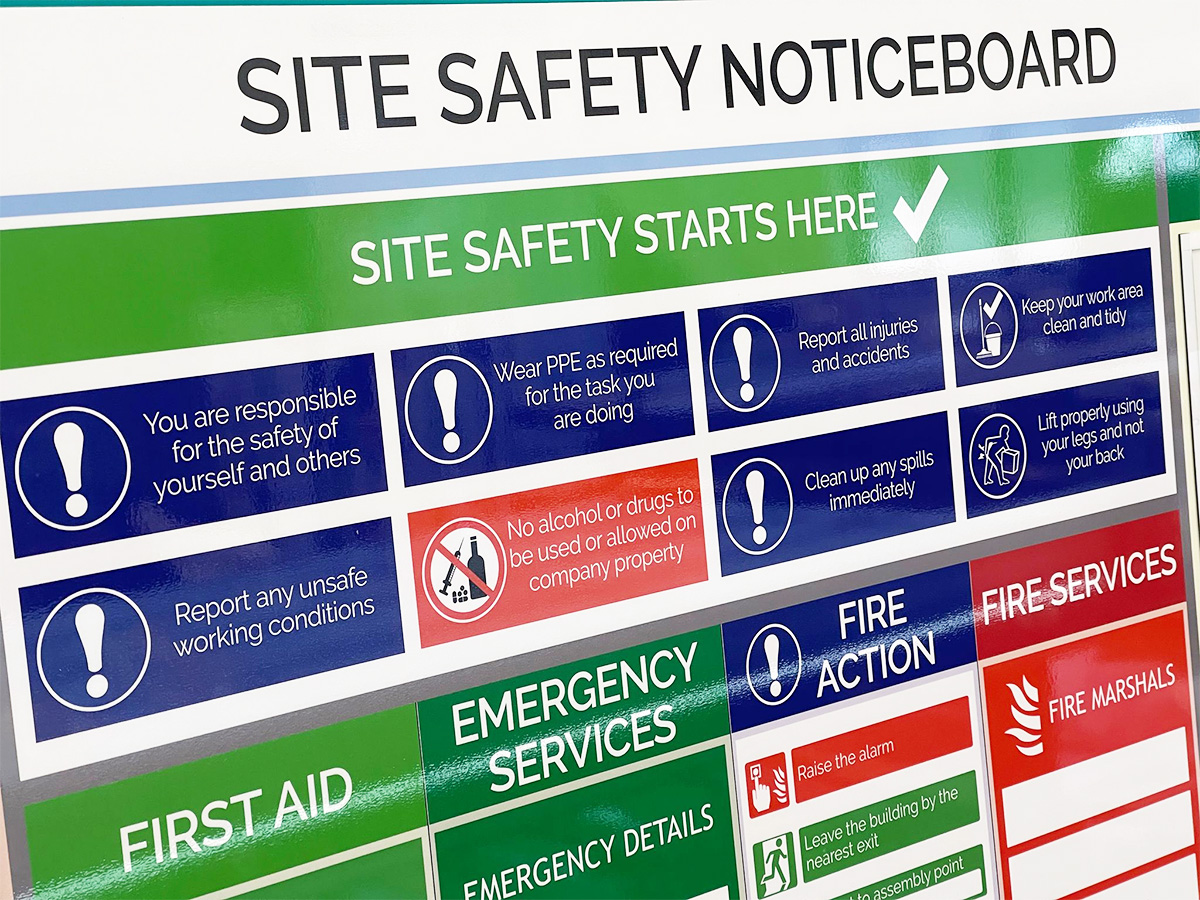
Communicate your safety rules

Show your supervisors

Show your First Aiders

Show your Fire Wardens

SHEQ board

Site Safety Noticeboard

Employee Information Board

Key Information Board

Emergency contact information

Show all your H&S information

Reporting Board

Safety Training Board

Emergency Response Team Board

amazonfresh safety board

Update names easily

Site Safety board

Fire Marshalls information

Communications Board
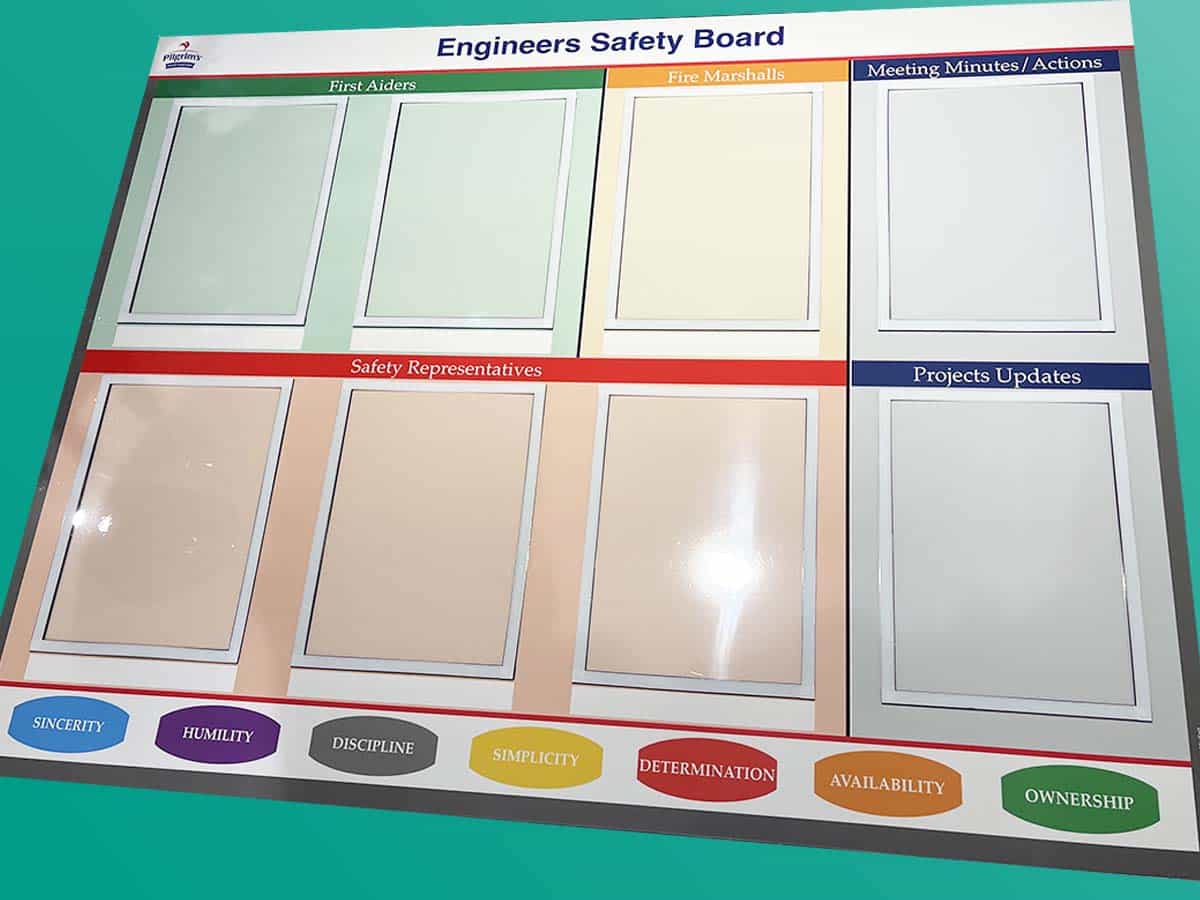
Engineers Safety board

Display your H&S policies
Communications for H&S

Use graphics for impact

Safety board for your team

Emergency response board

Stainless steel document holders
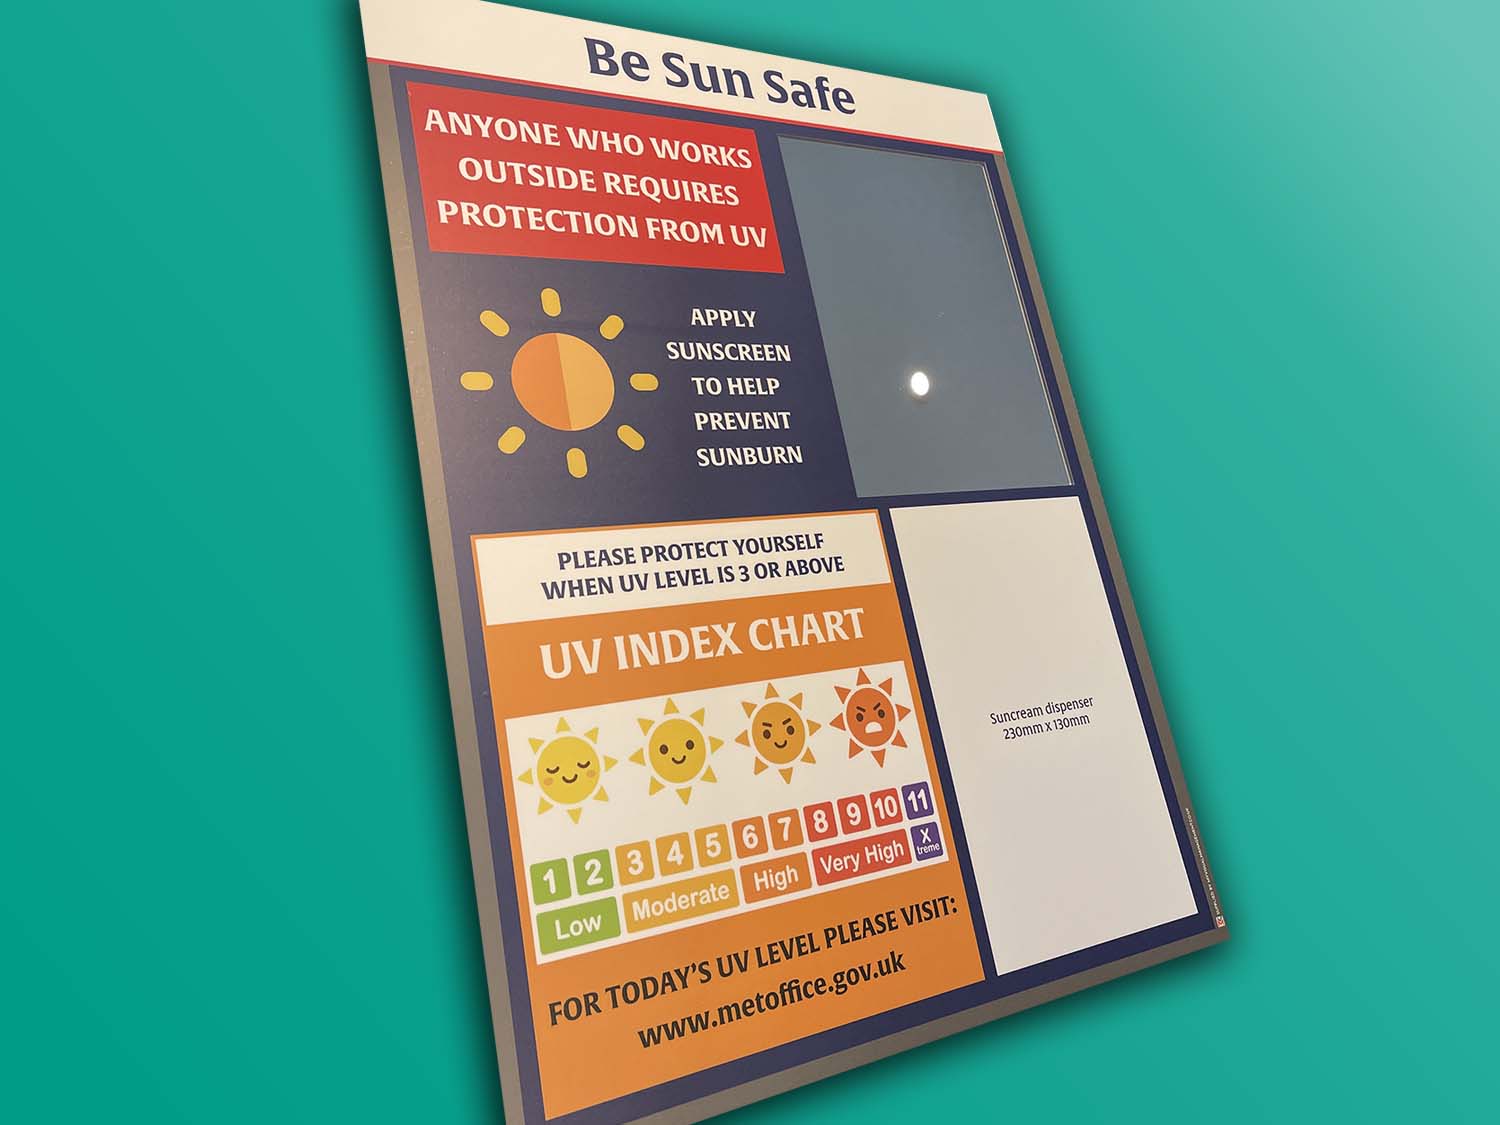
Sun Safe board

Safety Information Board

Display your Site Rules

Handheld whiteboard for daily briefings

Document holders keep information safe
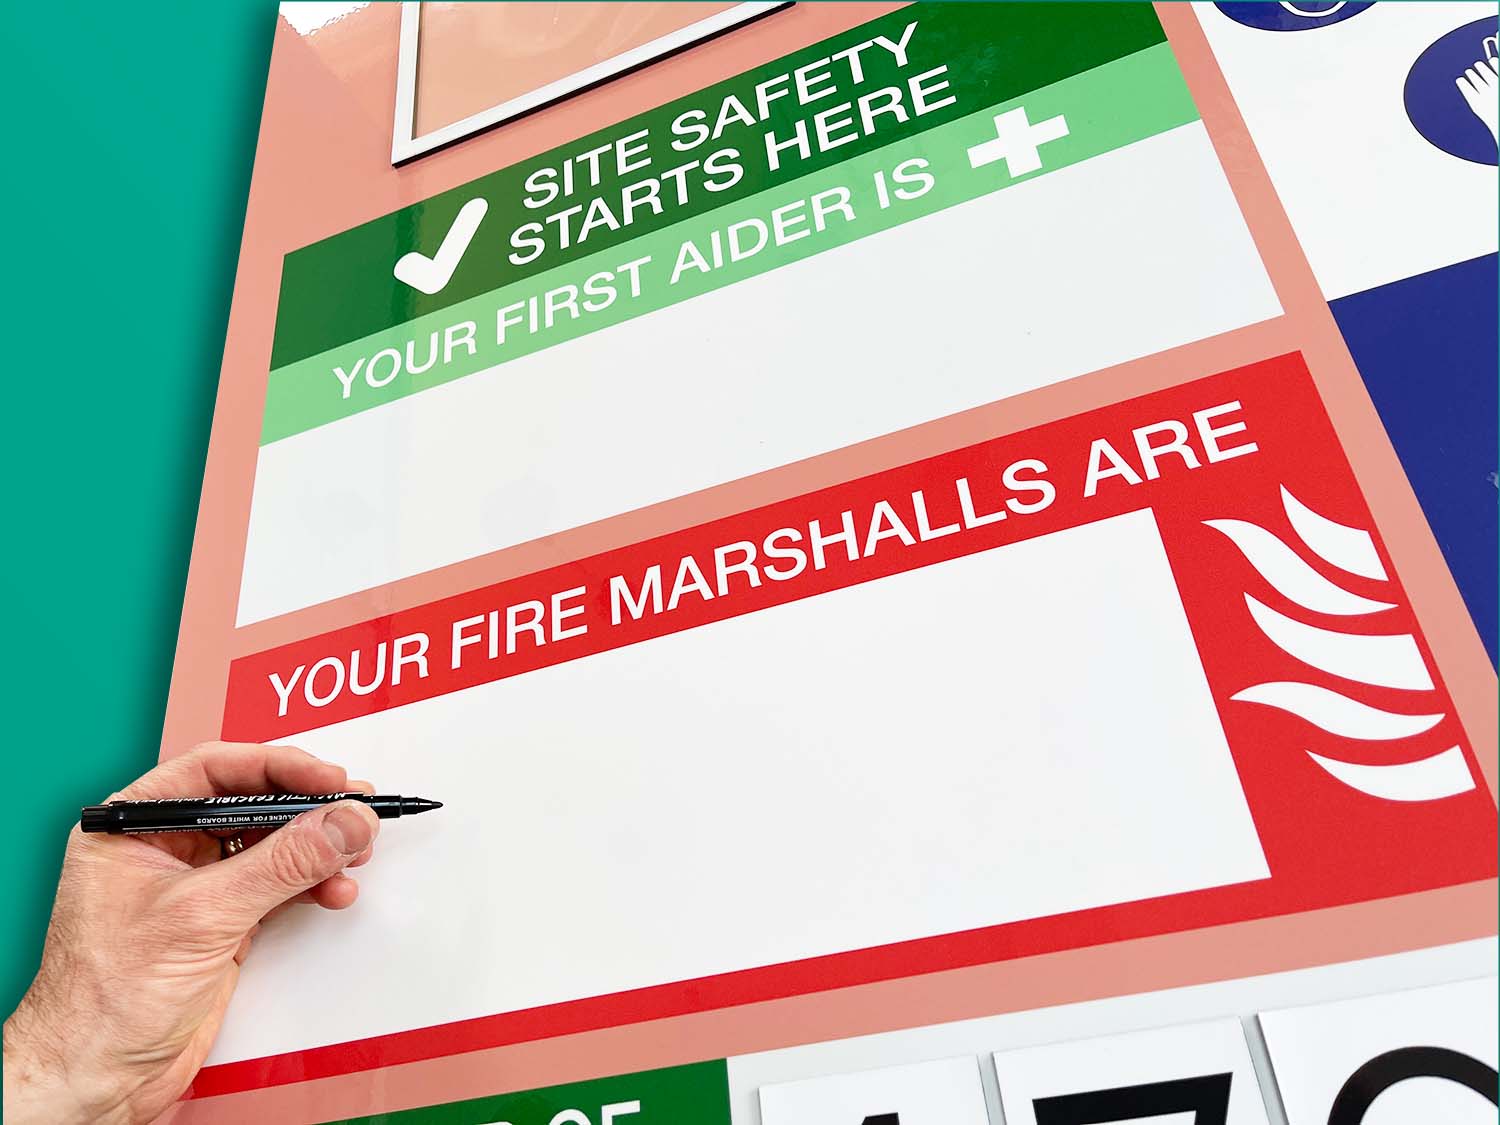
Update easily with dry wipe option

Near Miss card

Communicate H&S visually

Keep info safe with document holders

Display machinery safety rules

Safety equipment board

Highly visual with icons

Sanitisation check stations

Covid-secure visual management

Show rules visually for your team

Covid-secure signage

Sanitisation station boards

Site Rules boards
Our Approach
We create visual management boards everyday. As a result we have plenty of experience. We work for organisations in food production, the power industry, national rail, pharmaceuticals, education, healthcare, packaging and distribution.
Our team works with a simple idea or sketch and creates a professionally designed layout. This is then turned into a highly functional visual management board.
We offer customised options because we want to create the perfect board for you. So, here are a few examples. We can add magnetic areas or a dry-wipe finish (for use with whiteboard pens). Furthermore, you can choose Red/Green sliders or R.A.G. (Red, Amber, Green) status dials so you can quickly and visually update your board. These are just a few examples of the ways in which our boards can be tailored to meet your needs. You may also be interested in whiteboard overlays that can be used on top of an existing magnetic board.