In three steps, here is how to make problem solving visual
- Choose your problem solving model(s). Above all, select the ones that are most successful to your team. See further examples below…
- Gain inspiration from our problem solving board gallery. In other words, see successful ways for how to make problem solving visual
- Reach out and take the first step to make your own problem solving board. In short, start here
Effective problem solving models to consider
The PDCA cycle
This lean strategy that delivers change through four steps. These are PLAN, DO, CHECK, ACT. Firstly, come up with a plan to solve the problem. Secondly, do it. In other words, implement your plan. Next, check results. That is to say, analyse how the plan has works. Finally, act on those findings. So, learn from your results. Furthermore, if necessary, work your way round the PDCA cycle again until the successful solution is found.
Root Cause Analysis
Root Cause Analysis (RCA) is a structured problem solving method which aims to identify and solve the related issues of a particular problem, and to provide potential solutions. It is usually made up of five steps: gather data, produce a problem statement, analyse cause and effect, provide solutions and report on process. So, the RCA process assumes that events and systems are interrelated so that an action in one area will have an effect on another area, and so on. Consequently, this sometimes reveals more than one root cause.
Fishbone Diagram
One popular way to tackle RCA is to approach the problem visually with the use a Fishbone diagram, as shown here. In addition, relevant categories to the workplace are used to brainstorm potential issues, in order to consider underlying causes. It can be used to eliminate areas and more closely identify the likely root cause. Furthermore, these diagrams are also called cause and effect diagrams.
The 5 Whys
Often compared to the ‘toddler approach’, the 5 Whys approach to RCA is a common technique. Every answer to a ‘Why’ question is followed up by an additional ‘Why’? Moreover, this method prevents assumptions and can produce detailed responses which serve the Root Cause Analysis process. In some cases, it may take more or fewer Whys to identify the root cause of the problem. So, the 4 Whys method helps to understand the chain of a problem and is regarded as a highly effective evaluation tool. Read more on 5 Why visual management boards.
A3 problem solving board
In addition, RCA can be included as part of the A3 problem solving method, a highly visual lean management tool. Combine 5 whys, root cause analysis, an action plan with status tracking and reporting data all in one place. The method aims to solve issues with increased collaboration, simple structures and enhanced communication. Read more about A3 problem solving.
Further ideas for how to make problem solving visual
Please view this problem solving board gallery
Further examples
Our Approach
We create visual management boards everyday. As a result we have plenty of experience. We work for organisations in food production, the power industry, national rail, pharmaceuticals, education, healthcare, packaging and distribution.
Our team works with a simple idea or sketch and creates a professionally designed layout. This is then turned into a highly functional visual management board.
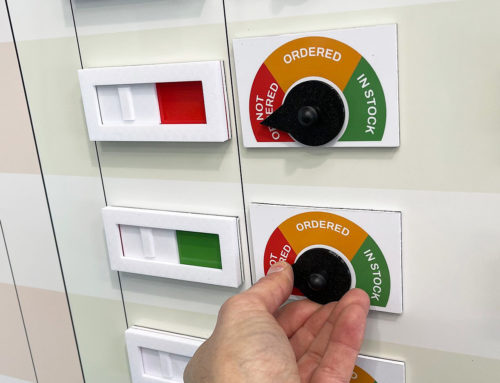
We offer customised options because we want to create the perfect board for you. So, here are a few examples. We can add magnetic areas or a dry-wipe finish (for use with whiteboard pens). Furthermore, you can choose Red/Green sliders or R.A.G. (Red, Amber, Green) status dials so you can quickly and visually update your board. These are just a few examples of the ways in which our boards can be tailored to meet your needs. You may also be interested in whiteboard overlays that can be used on top of an existing magnetic board.


