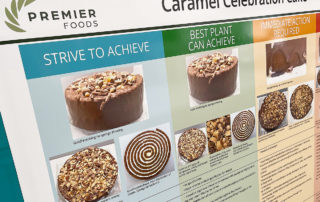
Visual Management in Food Production | Improving Consistency
Visual management in food production supports consistency, hygiene, performance and audit readiness across teams and shifts.
Visual management in food production supports consistency, hygiene, performance and audit readiness across teams and shifts.
Support your team and processes with a Daily visual management board. In other words, make relevant information visual and accessible, on a daily basis. Find out how.
Performance is often discussed in reports, meetings and systems. However, when key measures are not visible at the point of work, it becomes harder for teams to stay aligned, respond quickly and maintain consistent focus.
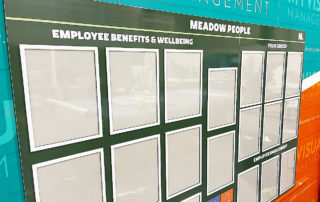
Workplace conversations around menopause are becoming more open, with many organisations recognising the importance of providing consistent, practical support for employees.
Recent Health and Safety Executive (HSE) statistics have increased attention on how organisations manage work-related stress and mental wellbeing. Use visual management to support routine, wellbeing and mental health awareness at work
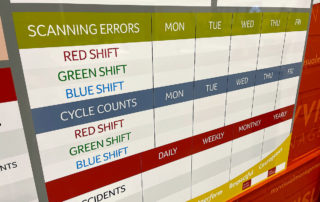
Explore how visual management supports clearer shift handovers by making status, priorities and actions visible across teams and shifts.
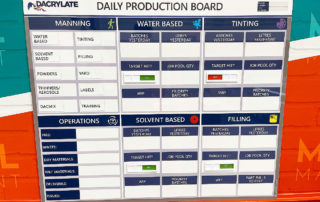
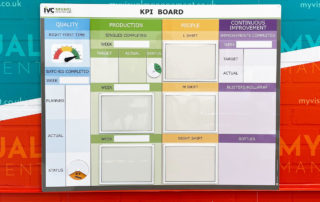
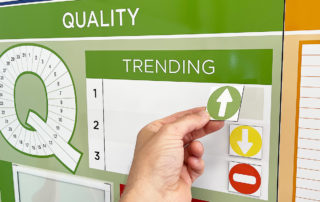
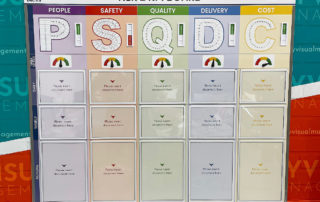
High-volume production plants are adopting KPI boards to improve performance visibility, strengthen communication and support faster decision-making on the shop floor.
US logistics and fulfilment centres are using visual controls to improve accuracy, speed and alignment across fast-moving operations. Explore how clarity drives performance.
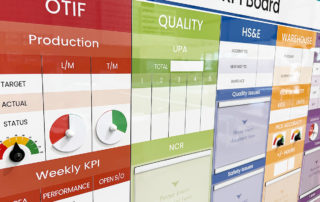
KPI boards are helping lean teams improve visibility, strengthen communication and maintain daily focus. Learn why they’re becoming essential in 2026.
Visual management delivers greatest impact when rolled out as a coordinated campaign, rather than a series of disconnected boards. Learn more