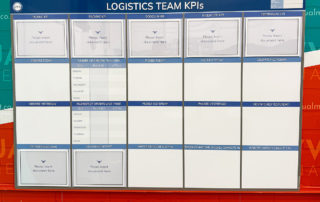
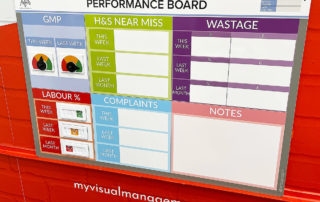
Latest visual management examples
See our latest visual management examples. As a result, get ideas. Likewise, drive Continuous Improvement. Above all, make most relevant information visual. Furthermore, accessible at a glance. Here’s how...
Find out how to use visual management for your Focus Board. In addition, see relevant examples to gain inspiration. Read more here.
Implement your own supply chain KPI board. So, similar to the one shown here. Nevertheless, show your own content. As a result, meet the needs of your site. Likewise, show your own performance indicators relating to supply chain.
See this example of a Production Floor KPI Board. Similarly, get ideas for your own KPI boards. In other words, make KPI boards for your own setting. As a result, make your own KPIs visual and accessible, at a glance.
Support your team and processes with a Daily Meeting Board. In other words, make relevant information visual and accessible, on a daily basis. Find out how.
Make your own KPI Status Board. So, like the one shown in this case study. As a result, make your own key performance indicators visible. Likewise, accessible at a glance. Above all, choose what KPIs to show on your own board.
See how to make your own KPI visualization board. As a result, give your team at-a-glance reference for Key Performance Indicators
Use daily tracking, as showing on this Foundry SQD Board. This example visually tracks Safety Quality and Delivery for the foundry setting.
Employ a Continuous Improvement workstream board to track your projects and through your work flow. Find out more...
Use an Operations Strategy board to keep track of your chosen metrics. Find out more with this Case Study.