By My Visual Management — Making Problem Solving Visual
In manufacturing, healthcare, logistics and other operational industries, problem solving is not an occasional activity — it’s a daily requirement. Yet too often, the root causes of problems remain hidden within complex processes and disconnected data.
Visual management transforms this challenge. By making performance, issues and standards visible, it enables faster, structured and more effective problem solving. When problems are seen clearly, they can be solved systematically.
Making Problems Visible
Every process generates data, but data alone rarely drives action. In fast-moving environments, performance reports or dashboards are often reviewed too late to prevent issues.
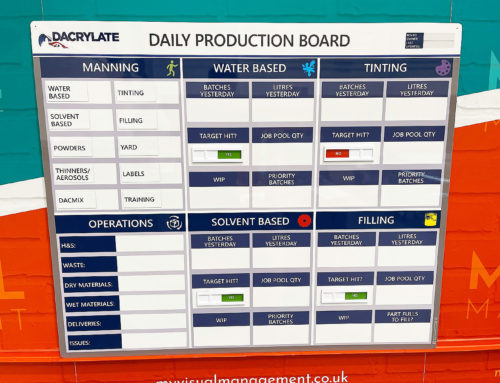
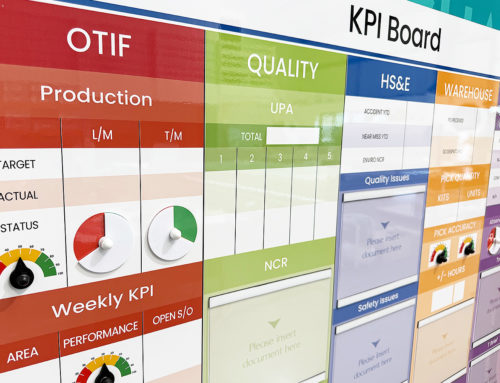
Visual management problem solving closes that gap. Performance boards, Andon systems, and problem-solving walls translate data into clear, visual cues — turning invisible process deviations into visible signals.
A red performance marker, a downtime tracker or a highlighted trend line all serve the same purpose: to make abnormal conditions obvious and prompt immediate action.
Key Insight: Visibility transforms reaction time. The faster a problem becomes visible, the sooner the team can begin structured problem solving.
Driving Structured Problem Solving
Visual management directly supports established continuous improvement methods such as PDCA, A3 Thinking and Root Cause Analysis.
-
PDCA (Plan–Do–Check–Act): Visual boards help teams track each phase of the cycle, from identifying issues to implementing and verifying solutions. Real-time visibility keeps PDCA active rather than periodic.
-
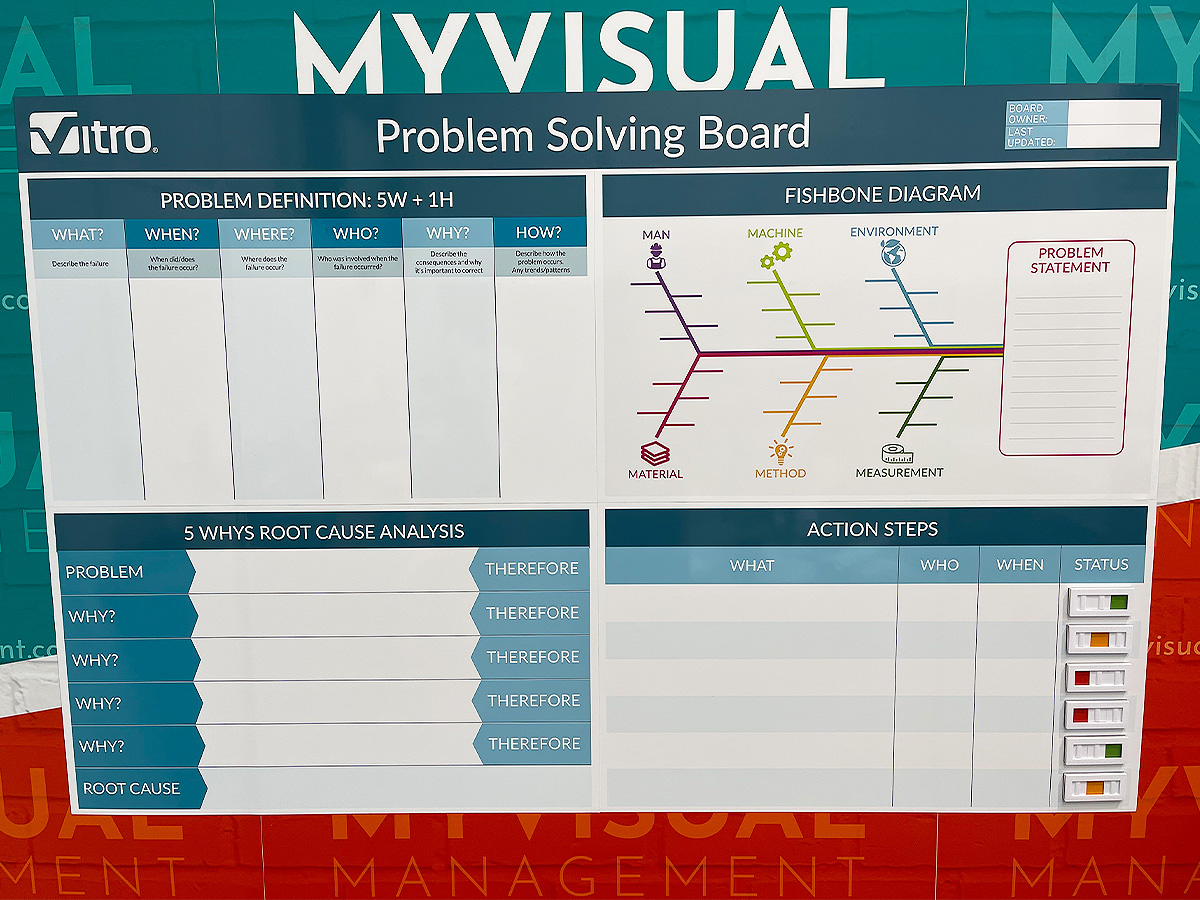
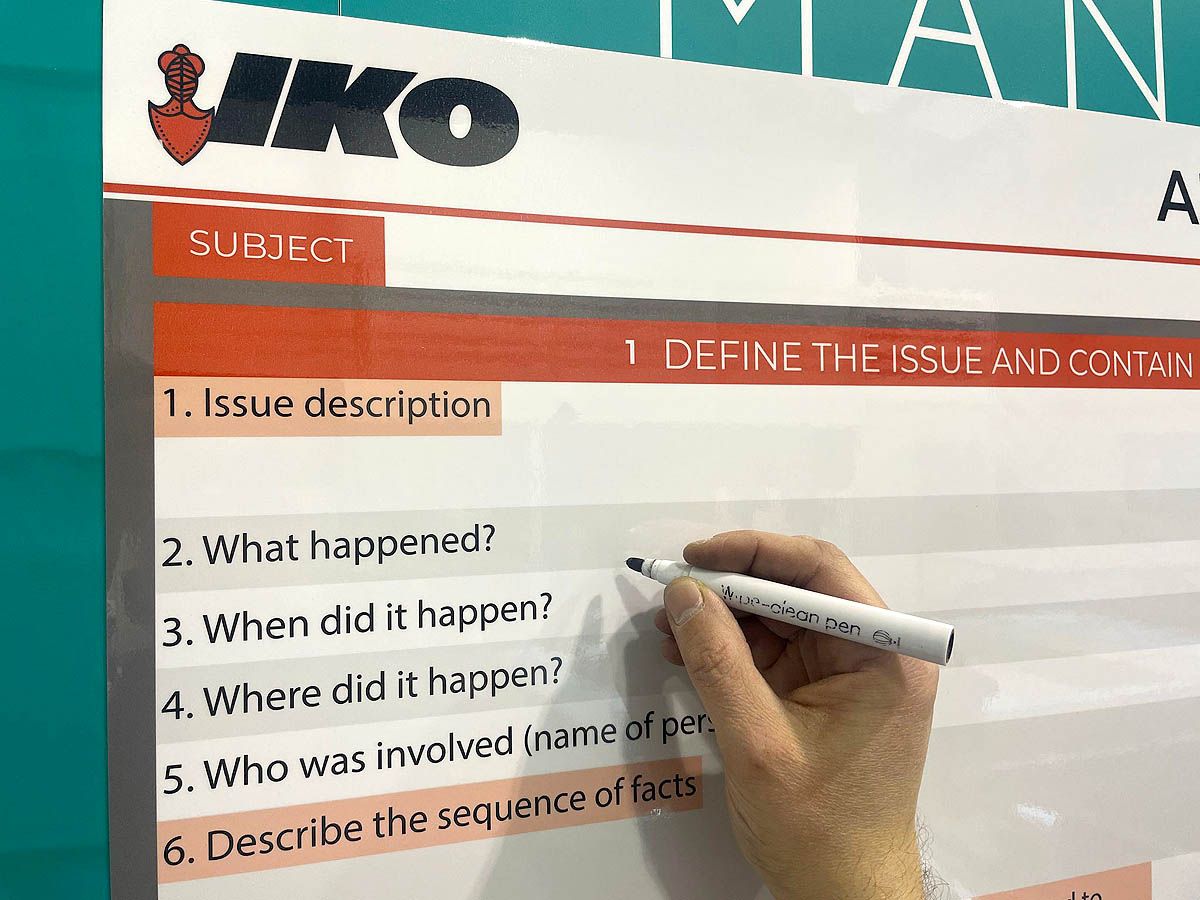
A3 Thinking: A3 problem-solving boards guide teams through logical steps — defining the problem, analysing causes, developing countermeasures and tracking results — all in one visible format.
-
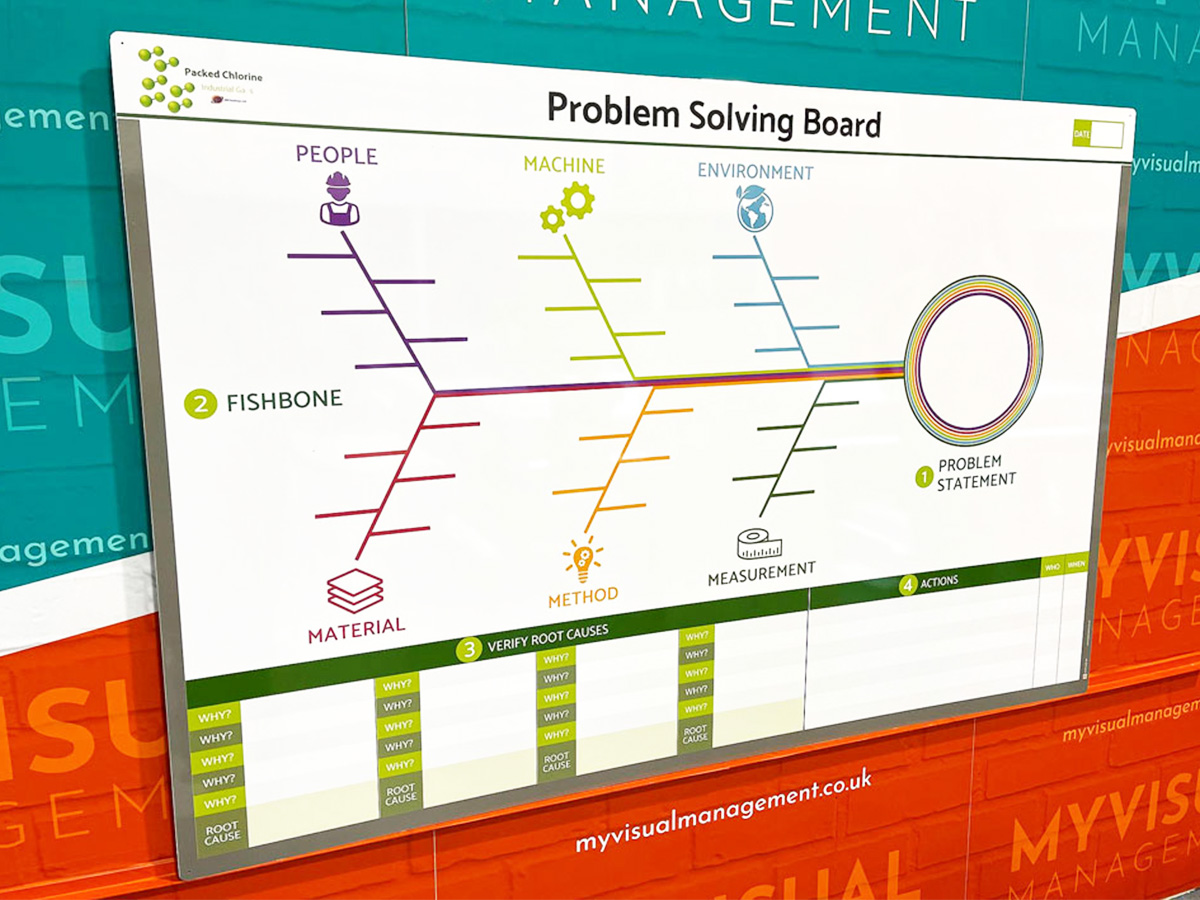
Root Cause Analysis: Visual cause-and-effect diagrams, Pareto charts or “5 Whys” boards encourage disciplined analysis, preventing teams from jumping to quick fixes.
By embedding these methods into daily routines, visual management ensures that structured problem solving becomes part of how work is done, not an extra activity.
Key Insight: Visual tools sustain discipline in PDCA, A3 and Root Cause Analysis by guiding teams through consistent, repeatable steps.
From Data to Action
The value of visibility lies in how quickly it leads to action. Effective visual management connects data, discussion and decision-making.
A typical workflow might include:
-
Detection: A visual indicator (for example, a red performance cell) highlights an issue.
-
Discussion: The team reviews the problem during a short stand-up meeting at the visual board.
-
Decision: The next step is agreed — containment, investigation or escalation.
-
Documentation: The issue and response are logged visually for transparency.
This process transforms problem solving from an abstract activity into a visible, shared discipline.
Key Insight: A visual trigger without a defined response is only decoration. Every indicator should link to a specific action path.
Engaging and Aligning Teams
Visual management problem solving works because it engages people. When performance is visible, accountability and collaboration naturally increase.
In daily meetings, visual boards allow everyone — from operators to managers — to see the same information, discuss the same problems and agree on the same priorities. This alignment reduces delays, miscommunication and duplication of effort.
In regulated environments such as healthcare or pharmaceuticals, visibility also supports compliance. Standard operating procedures, quality checks and safety metrics displayed visually help maintain control and ensure issues are acted upon quickly and consistently.
Key Insight: Shared visibility creates shared ownership. When everyone sees the same problem, everyone contributes to the solution.
Standardising and Sustaining Improvement
Continuous improvement depends on maintaining standards and detecting deviations. Visual management reinforces both.
-
Visual Standards: Work instructions, audit boards and process maps define what “good” looks like.
-
Visual Control: Deviations from standards — whether quality issues, delays or safety concerns — are immediately obvious.
-
Visual Learning: Completed A3s, before-and-after visuals and improvement metrics showcase results and reinforce learning.
Leaders can then use visual cues during Gemba walks to identify areas needing support or escalation. Over time, the workplace itself becomes a communication system — one that continually reveals performance and drives improvement.
Key Insight: Visual management sustains improvement by making both standards and deviations continuously visible.
Beyond Manufacturing: A Universal Approach
Although visual management originated in manufacturing, its principles apply across all sectors.
-
Healthcare: Visual patient-flow boards enhance safety and coordination.
-
Logistics: Scheduling and capacity boards balance workload and prevent bottlenecks.
-
Energy and Biotech: Project tracking visuals maintain regulatory compliance and alignment across complex teams.
Digital tools now extend this visibility across multiple sites or hybrid teams. Whether physical or digital, the goal remains constant — to make information visible and actionable wherever work happens.
Key Insight: The effectiveness of visual management lies not in the medium — physical or digital — but in the clarity and consistency of the message it communicates.
Conclusion: See It, Solve It, Sustain It
Visual management problem solving brings clarity, structure and engagement to continuous improvement. By making performance and problems visible, it enables faster detection, structured analysis and sustained action.
When PDCA, A3 Thinking and Root Cause Analysis are supported by visual tools, teams solve problems not only more quickly but more effectively.
For any organisation seeking to strengthen its improvement culture, visual management is more than a display system — it’s a problem-solving system in its own right.
At My Visual Management, we believe that when people can see what’s happening, they can change what’s happening. By making the invisible visible, organisations can move from reactive firefighting to proactive, continuous improvement — one problem at a time.
At My Visual Management, we believe that when people can see what’s happening, they can change what’s happening. By making the invisible visible, organisations can move from reactive firefighting to proactive, continuous improvement — one problem at a time.
Making Problem Solving Visual.
Use a variety of practical problem solving methods
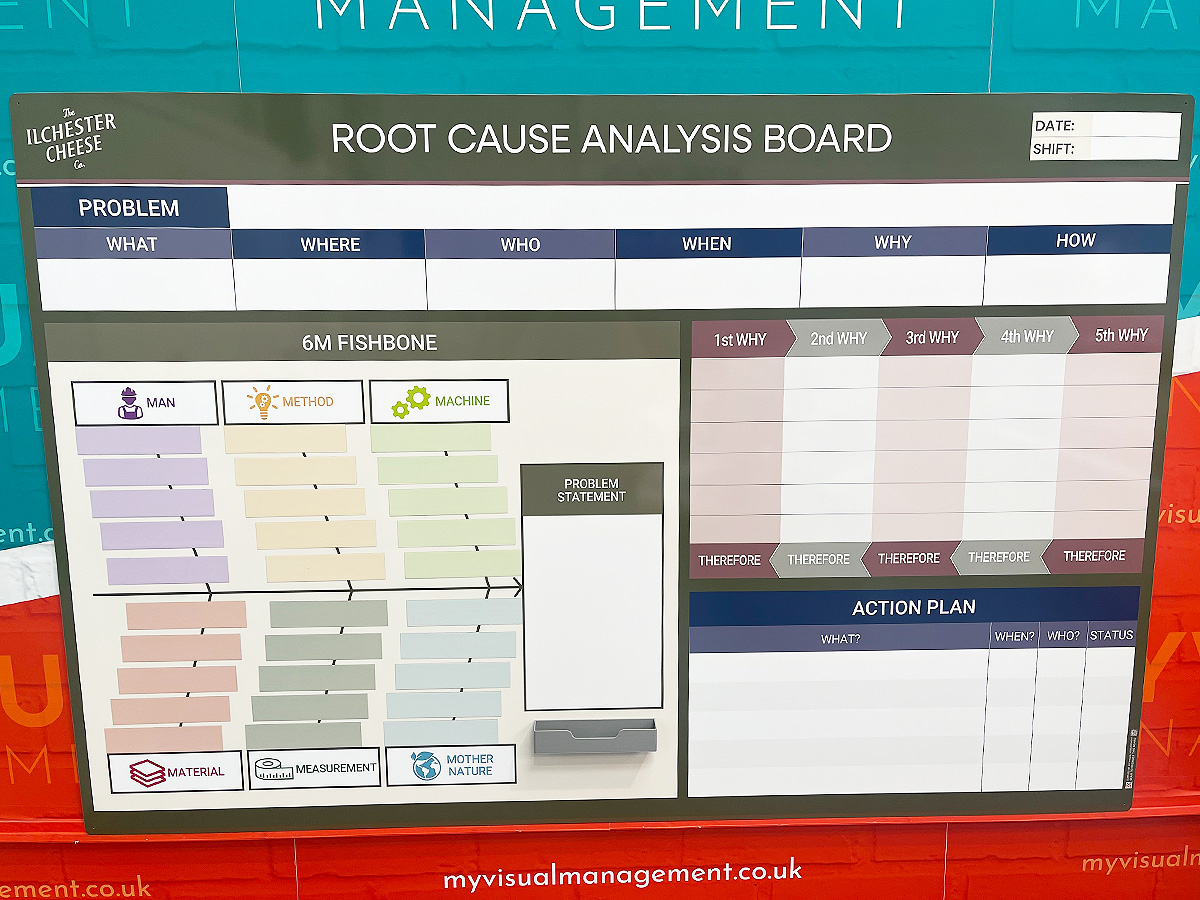
Add magnetic labels to your Fishbone
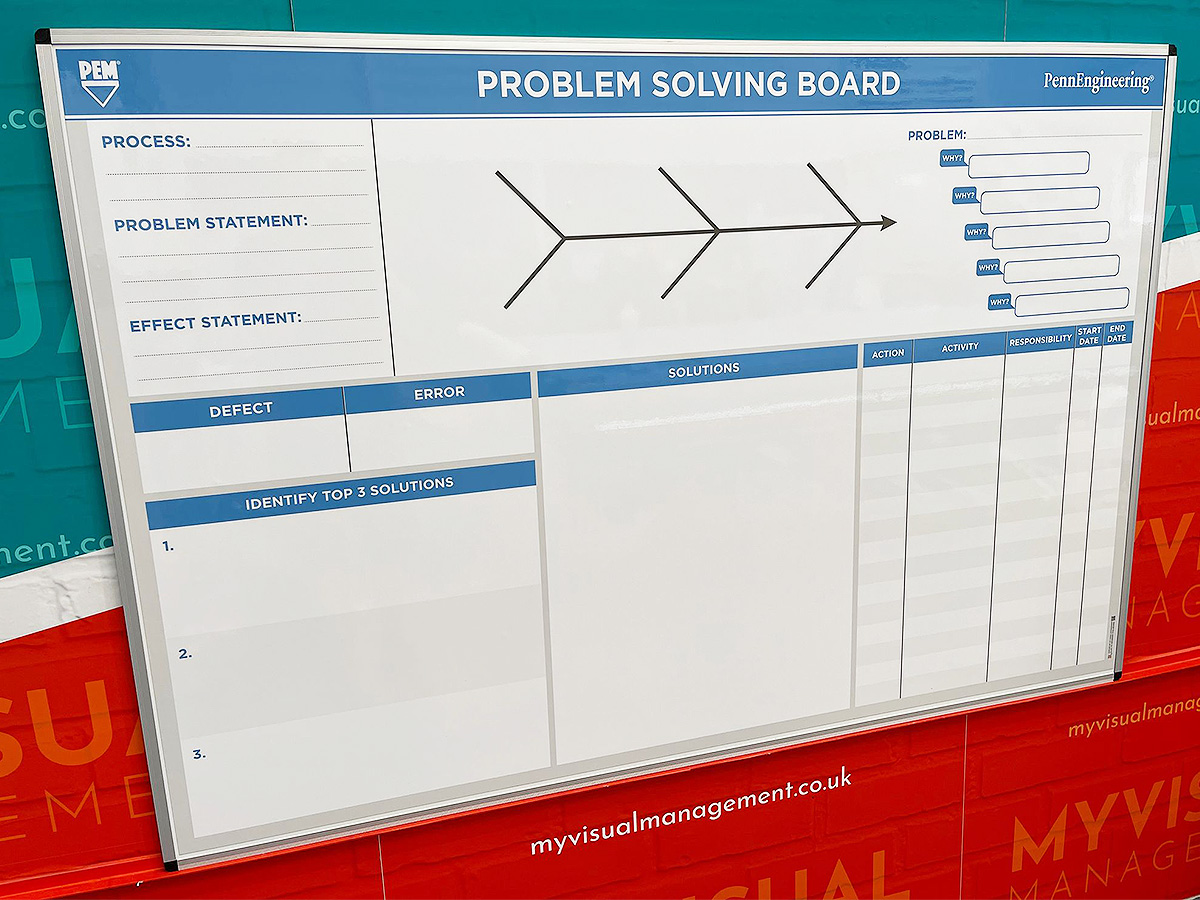
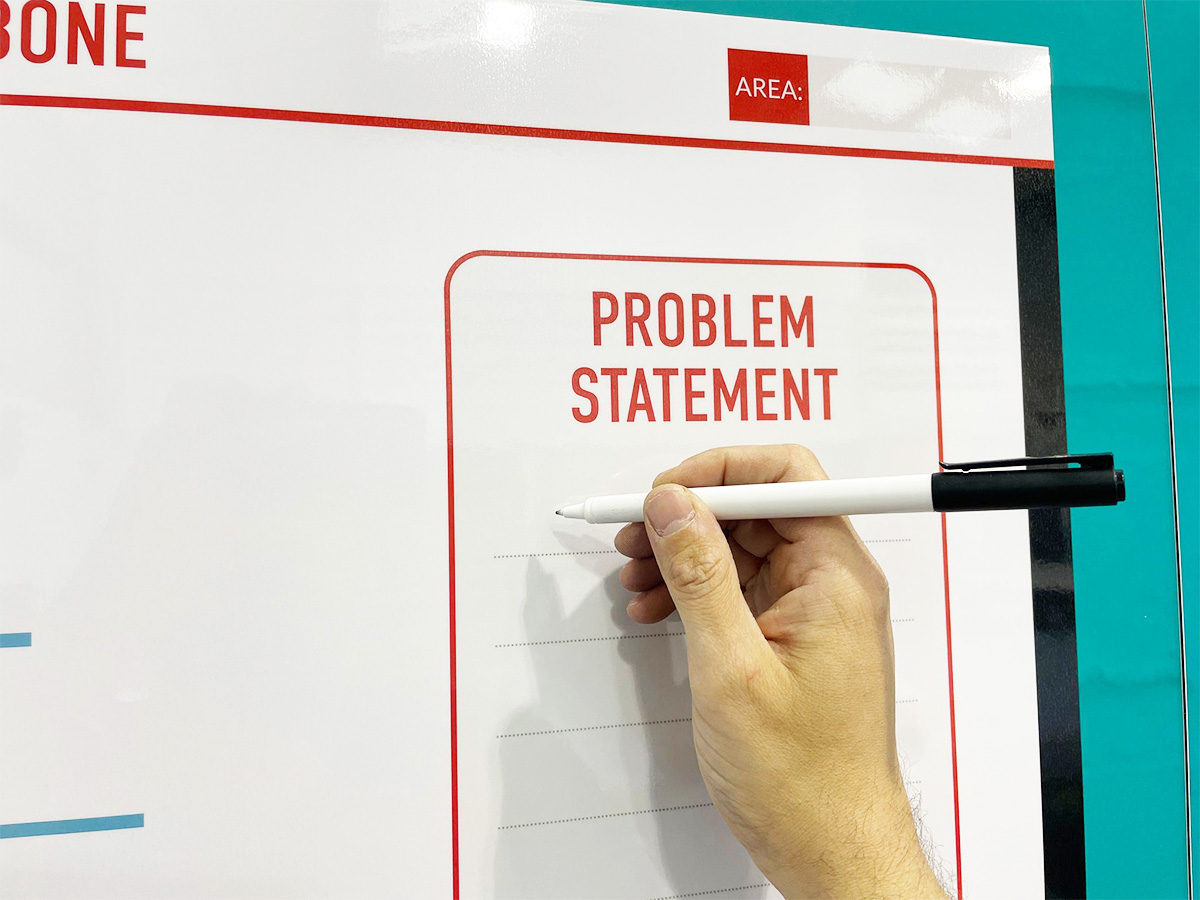
Define your problem statement
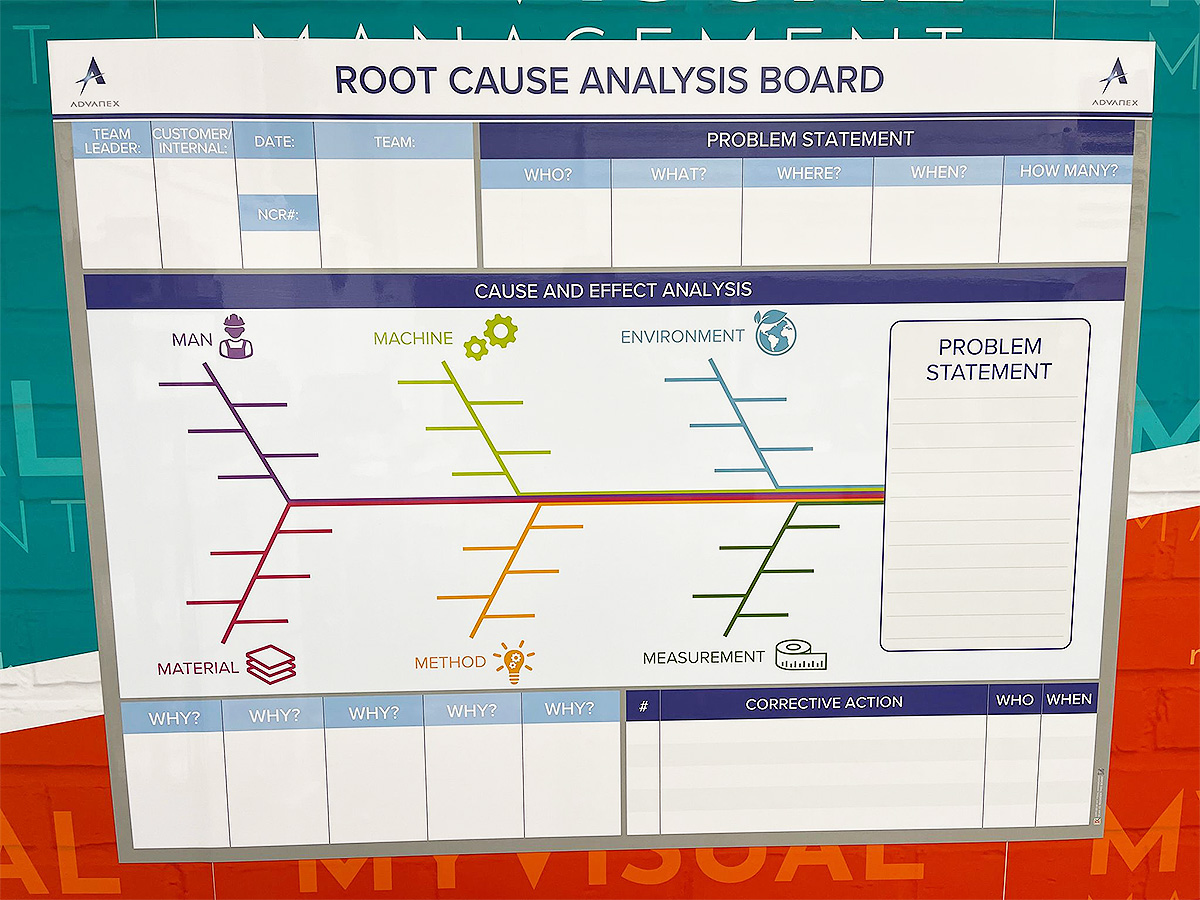
Root Cause Analysis in a visual way
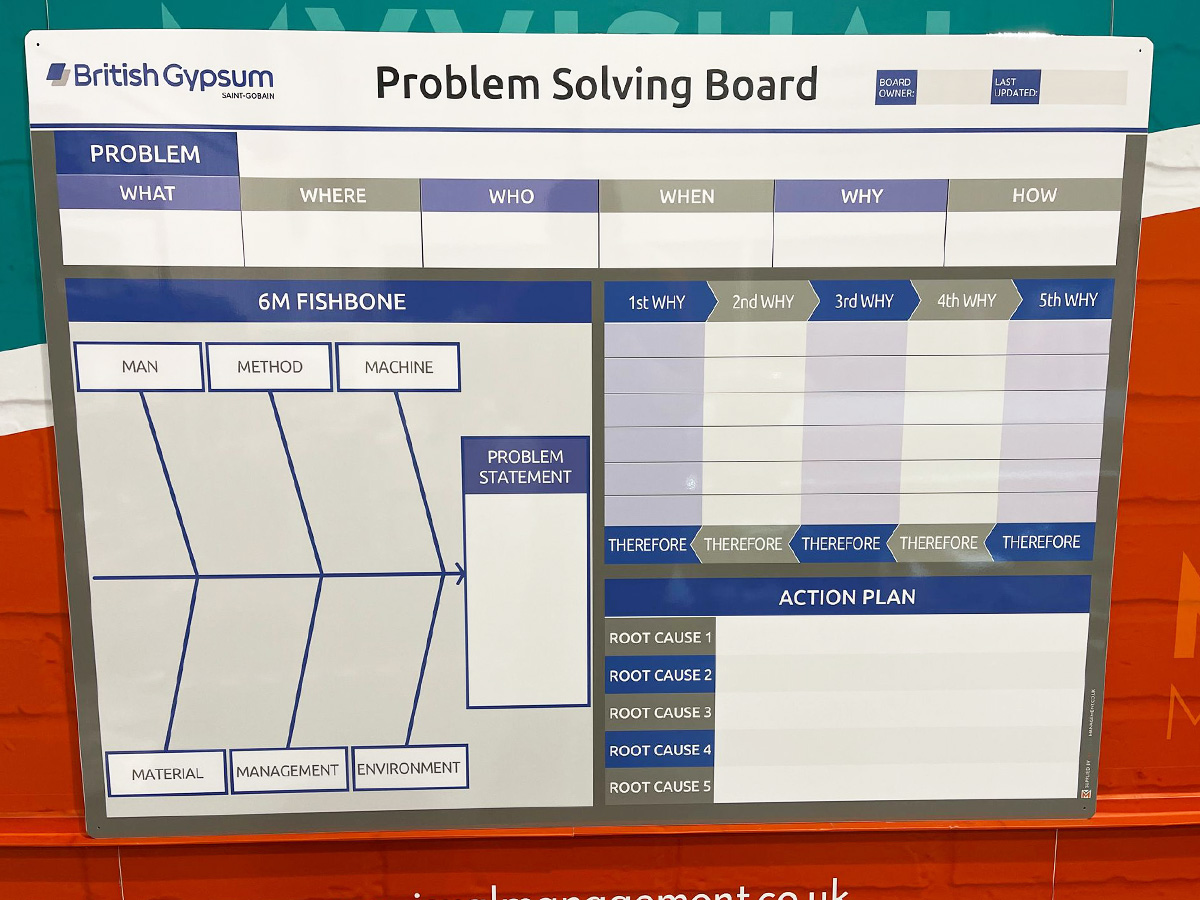
Make all your problem solving process visual
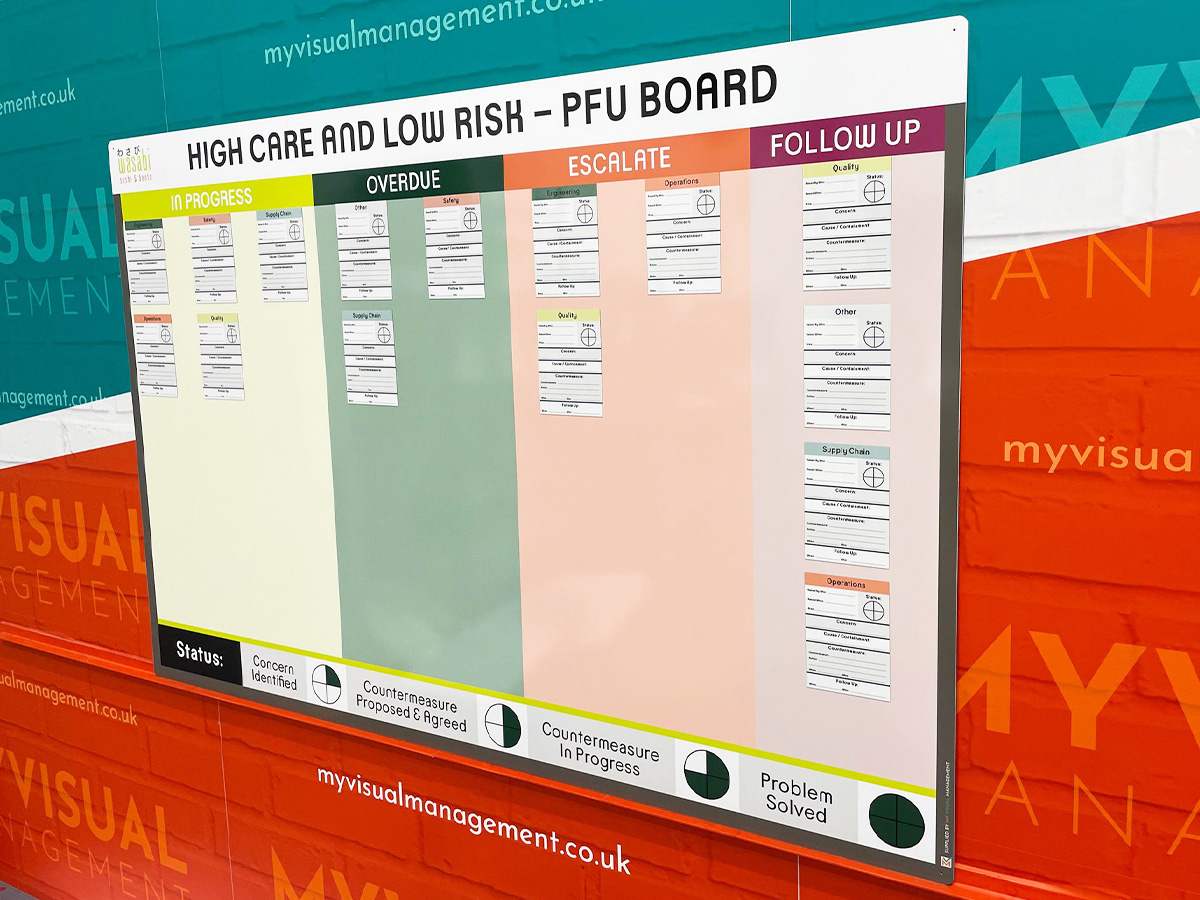
A PFU board with kanban tickets
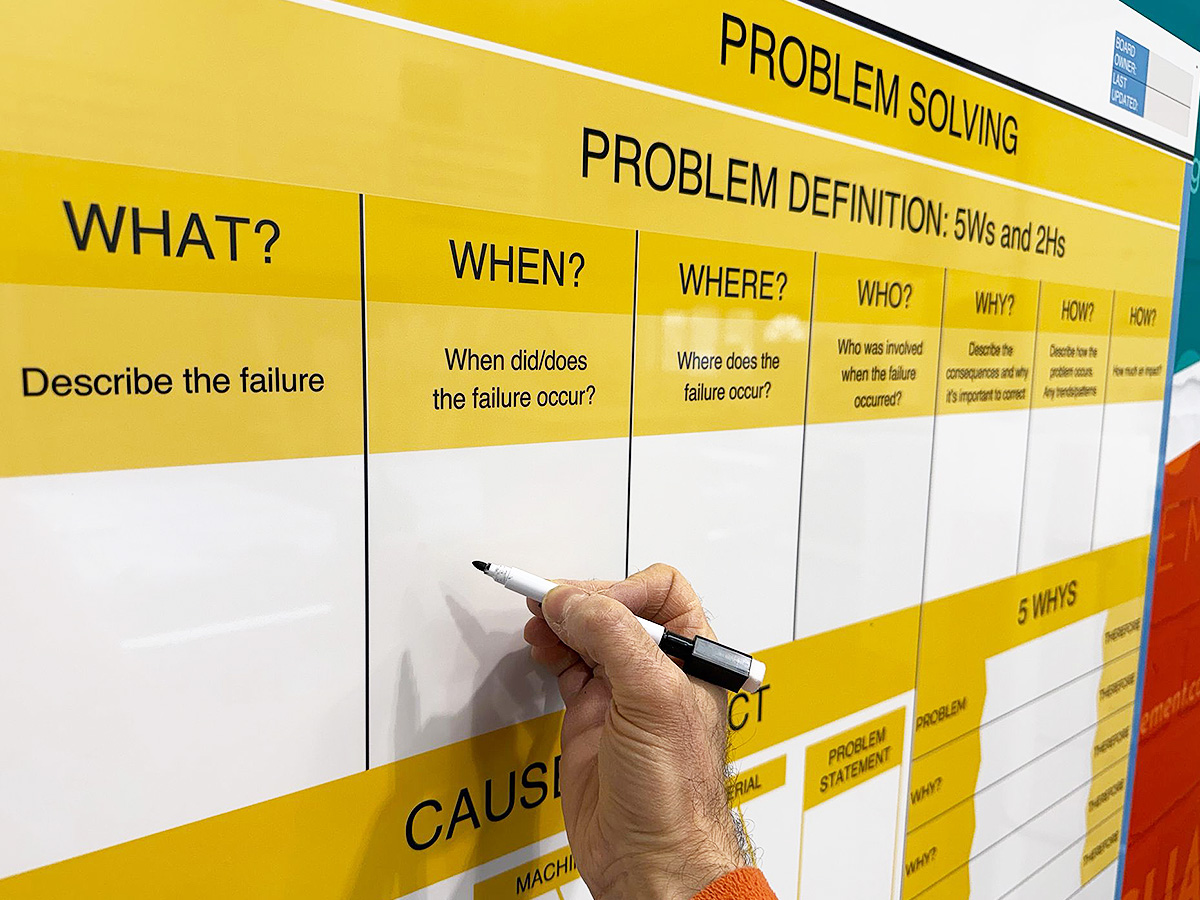
Using the 5 Whys prompts
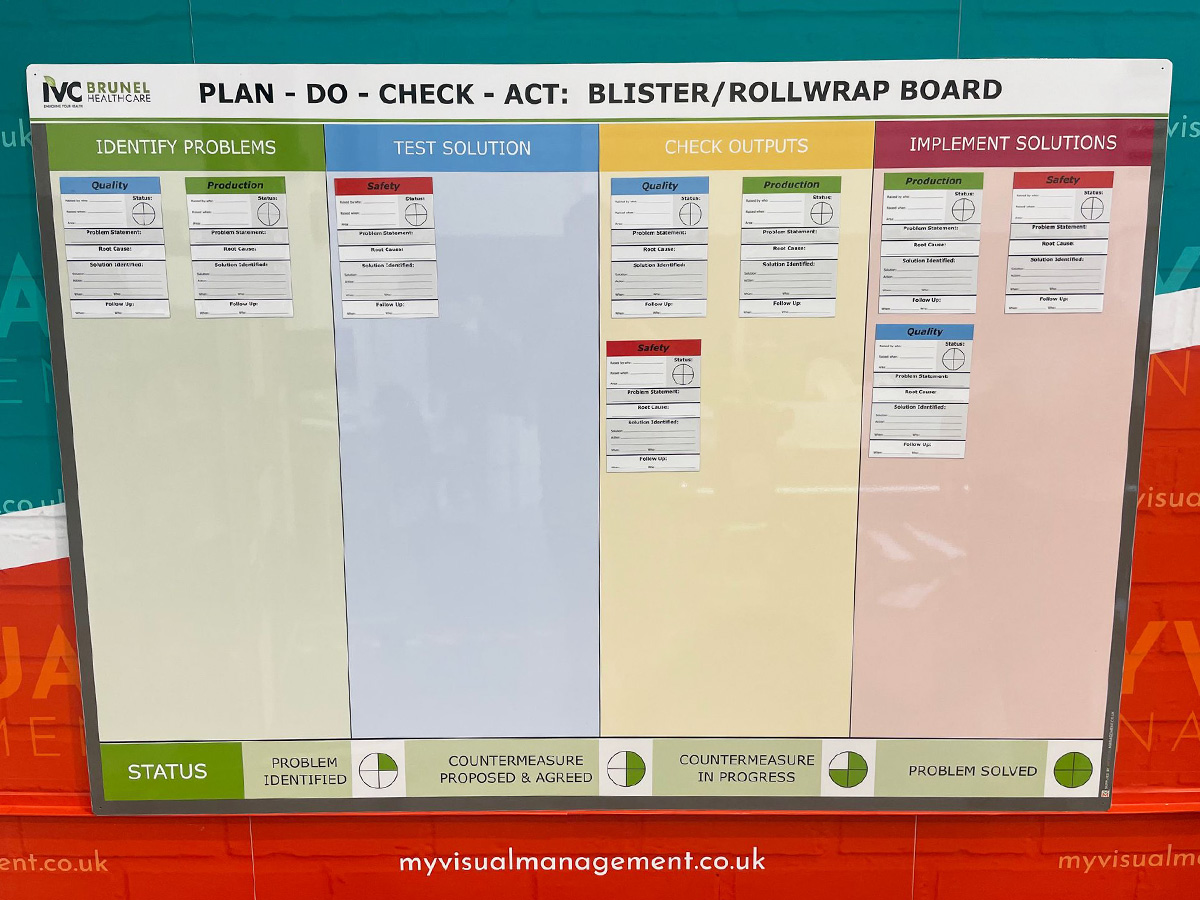
Plan Do Check Act for problem solving and continuous improvement
Use dry wipe for updating easily and quickly
A3 problem solving in action
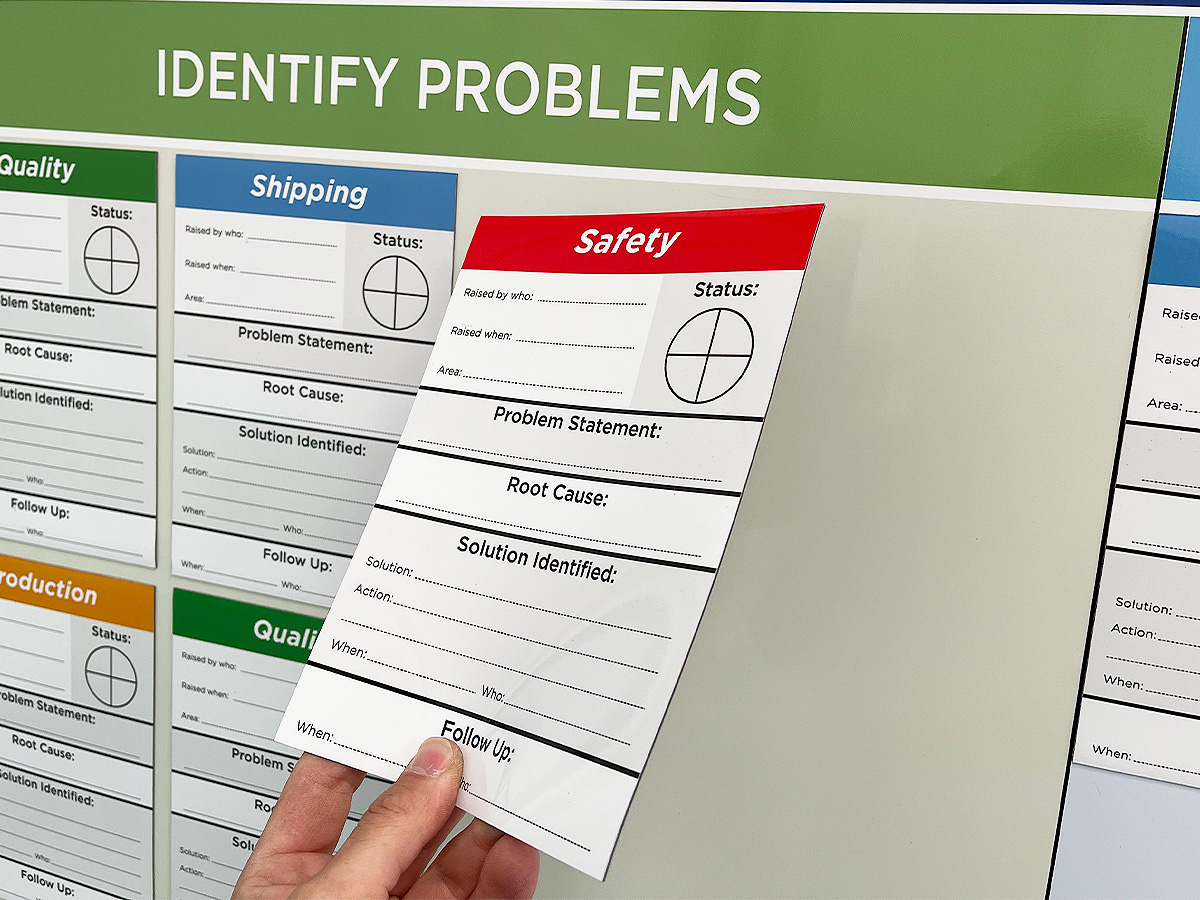
Our magnetic tickets move along your problem solving process
Visual problem solving accelerates improvement
Further examples
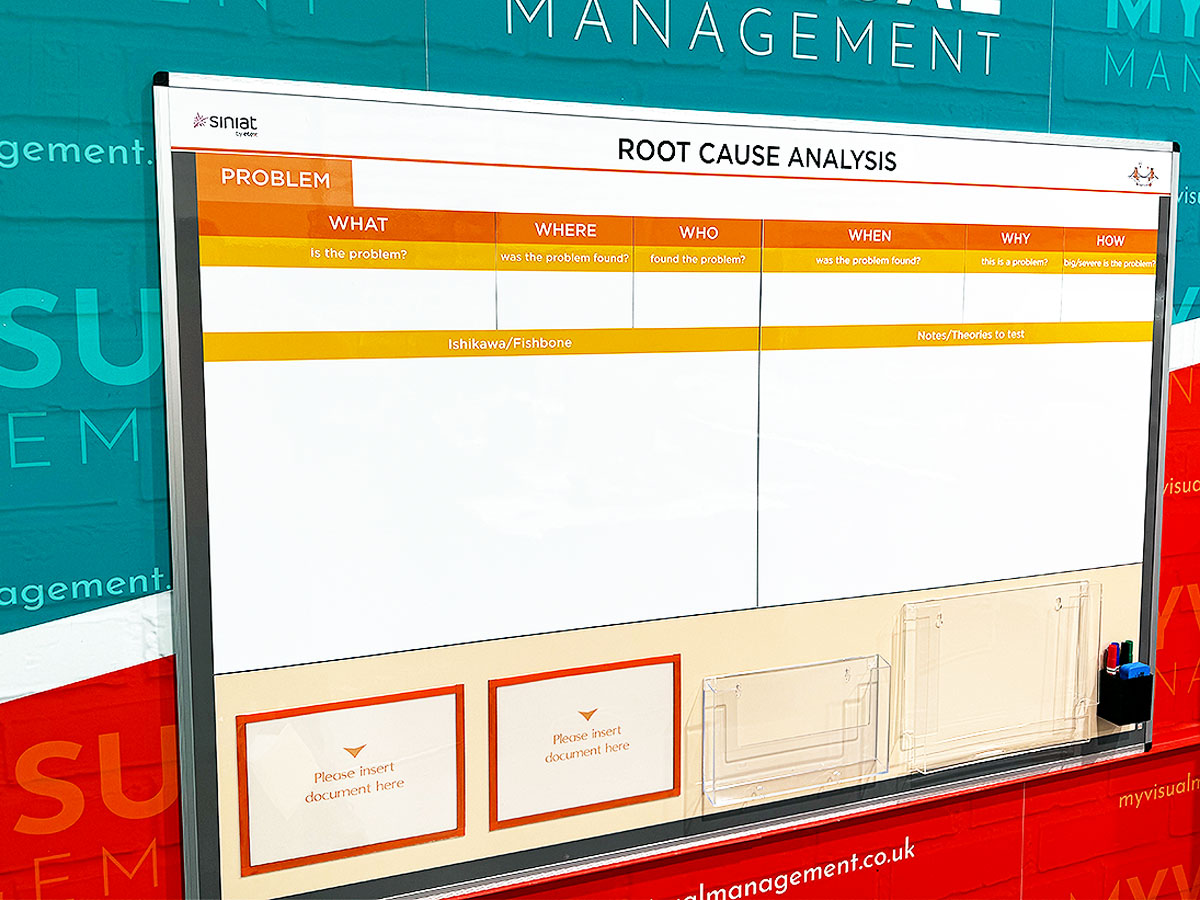

Root Cause Analysis

Short Interval Control

5 Whys Root Cause Analysis

Fishbone practical problem solving

Fishbone practical problem solving

Practical problem solving

Fishbone RCA board

FEMA board

5Ws problem solving board

RCA problem solving board

A3 Problem Solving
Problem Solving with fishbone

Root Cause Analysis

Concerns board problem solving

PDCA Kanban problem solving

3C action board

Fishbone root cause analysis

RCA board

Problem Solving magnetic tickets

Use the 5 Whys method

Make problem solving easy

Problem Solving board

Root Cause Analysis board

Problem Solving board

RCA board

Escalation board

Magnetic tickets for 5 Whys

Use a Fishbone diagram
Colour coded problem solving

Colour coded problem solving
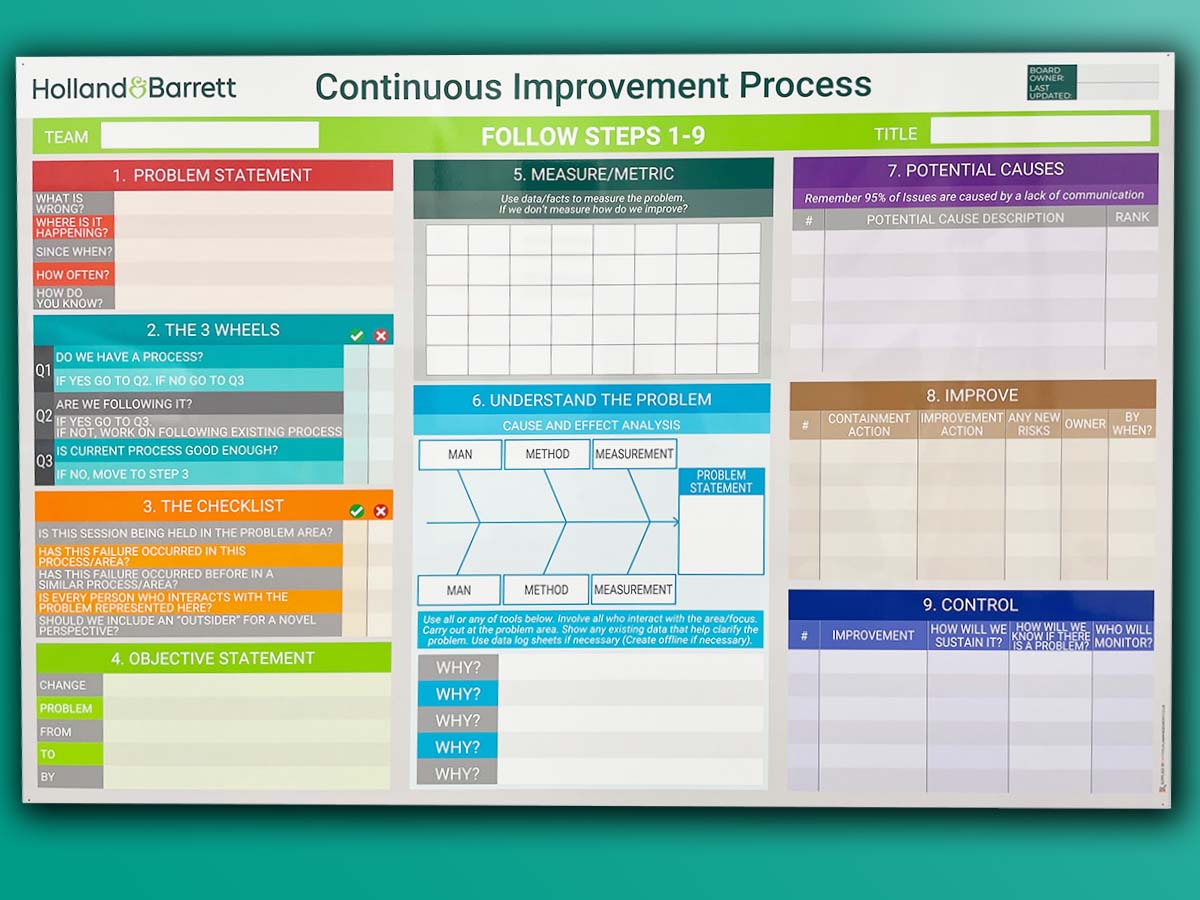
The Continuous Improvement Process
A3 practical problem solving

Define the issue with questions

Problem solving fishbone board
Colour coded problem solving

Fishbone diagram

Fishbone and 5 Whys

A3 problem solving board

Fishbone Root Cause Analysis

Tickets for problem solving

Add a Fishbone diagram

5M fishbone diagram
Problem solving tracker board

5 Whys root cause method

Solve problems visually
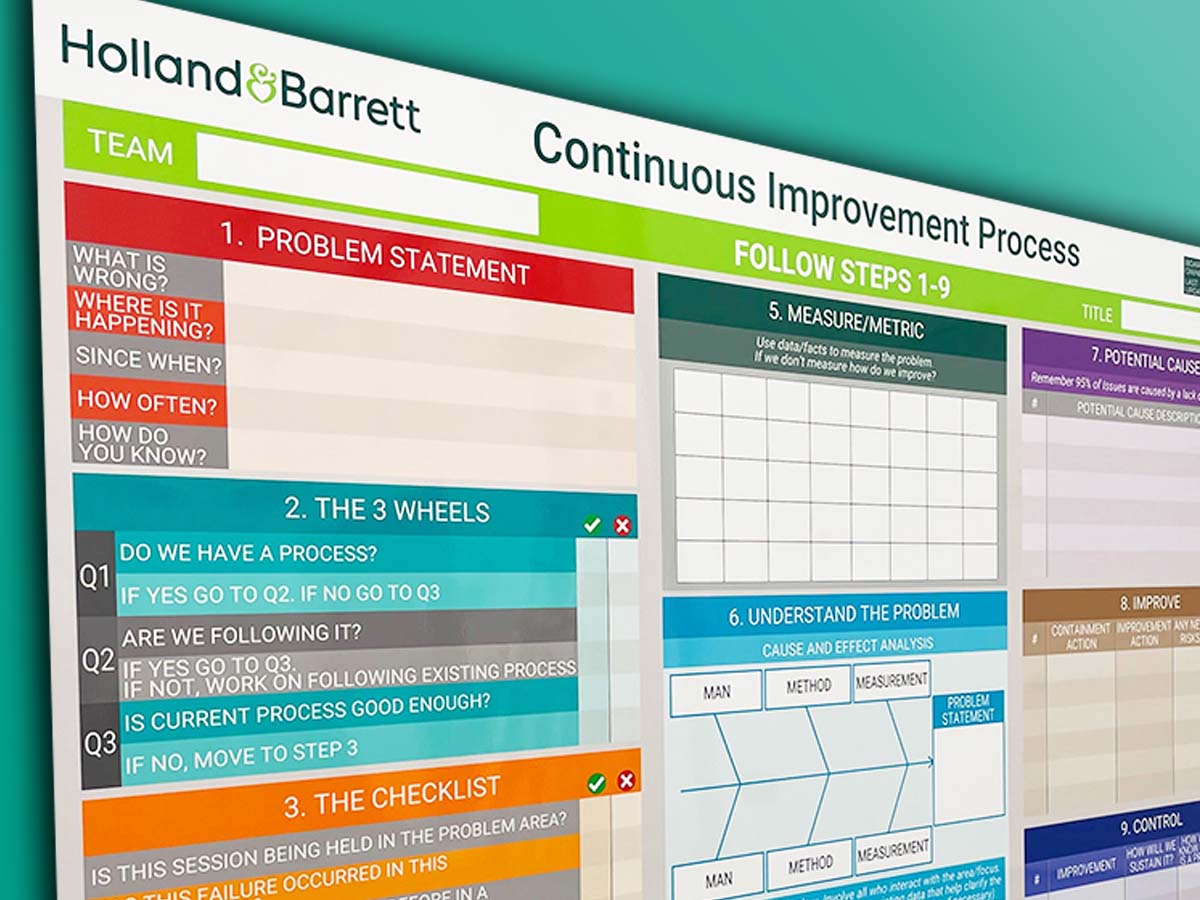
Continuous Improvement Process Board

A3 problem solving

A3 Summary problem solving

Root Cause Analysis

Analyse cause and effect

6M fishbone board
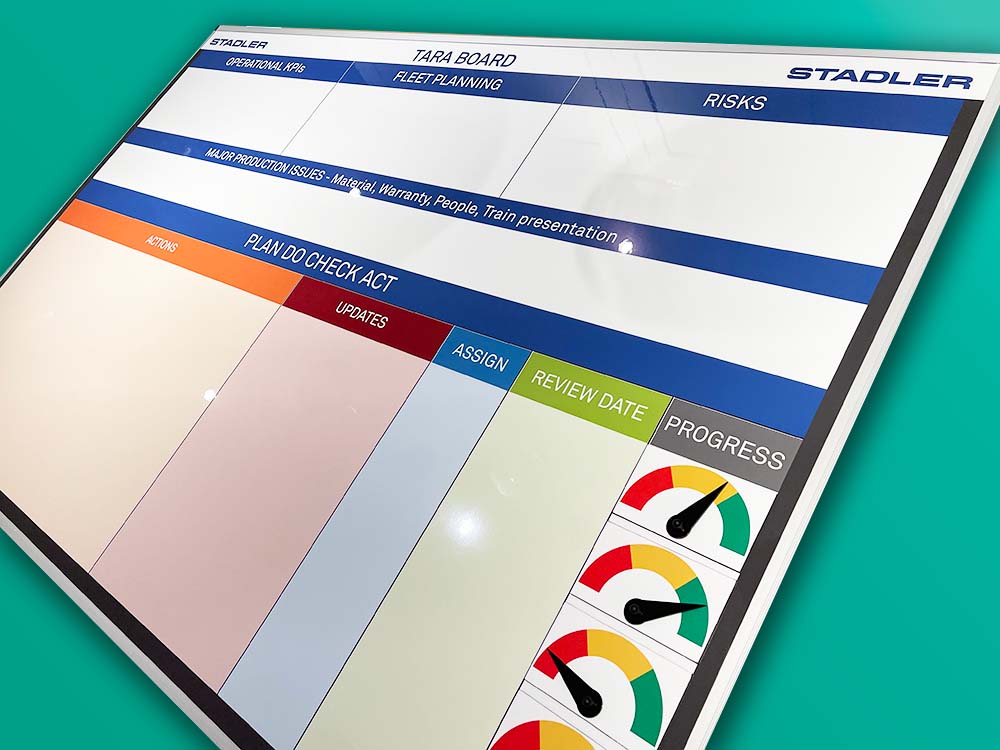
Tara board

5 Why problem solving method

Use colour and graphics on your board

Practical Problem Solving overlay

Investigate the 'Why'

Dry wipe fishbone diagram

Use DMAIC to problem solve

Brainstorm through your problems

Food production problem solving

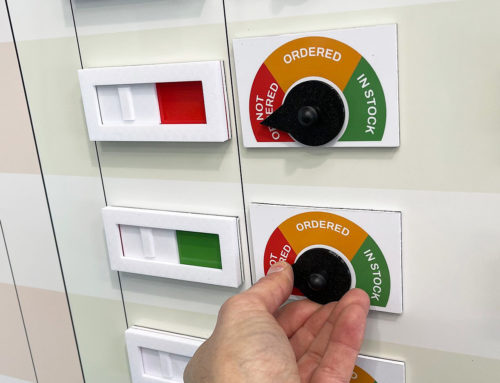
PFU board with status circles

Show your processes

Multilingual PFU board

PFU status indicators

Practical Problem Solving board

Practical Problem Solving board

Countermeasures and analysis

Custom designed PFU tickets

Durable ticket holders

Problem Follow Up ticket holders
Our Approach
We create visual management boards everyday. As a result we have plenty of experience. We work for organisations in food production, the power industry, national rail, pharmaceuticals, education, healthcare, packaging and distribution.
Our team works with a simple idea or sketch and creates a professionally designed layout. This is then turned into a highly functional visual management board.
We offer customised options because we want to create the perfect board for you. So, here are a few examples. We can add magnetic areas or a dry-wipe finish (for use with whiteboard pens). Furthermore, you can choose Red/Green sliders or R.A.G. (Red, Amber, Green) status dials so you can quickly and visually update your board. These are just a few examples of the ways in which our boards can be tailored to meet your needs. You may also be interested in whiteboard overlays that can be used on top of an existing magnetic board.